Tag: statistics

  • Email Marketing Statistics for ECommerce in 2022

    Most eCommerce brands focus on improving their social media presence. While social media is very important, a brand is missing out on a very big opportunity if it is not incorporating email marketing into its marketing strategies.

    So, if you think email marketing will not help you in growing your customer base and revenue then its statistics will be an eye-opener for you. In this article, we will be mentioning various email marketing statistics for eCommerce that will help you to create a powerful marketing strategy for your eCommerce brand.

    Why Should You Care About Email Marketing?
    Email Marketing Statistics for ECommerce in 2022

    Why Should You Care About Email Marketing?

    Number of Email Users Worldwide from 2017 to 2022
    Number of Email Users Worldwide from 2017 to 2022

    The following stats show why you should care about email marketing:

    • The number of email users worldwide in 2020 was recorded to be 4 billion. This number is expected to grow to 4.6 billion users by the year 2025. This stat shows that there is a huge opportunity to attract and engage users and ultimately increase the revenue of an eCommerce store.
    • In 2020, it was recorded that 306 billion emails were sent and received each day. This figure is expected to grow to over 376 billion daily emails in 2025. This shows that almost every other person is using email for communication. So, no matter how big or small your eCommerce business is, it is important that you should use emails to build a connection with your target audience.
    • 82% of marketers worldwide are taking advantage of email marketing to grow their business.
    • In 2020 the global email marketing market was valued at 7.5 billion USD.  This figure is expected to increase to 17.9 billion USD by 2027. This shows the true potential of email marketing.
    • For every 1 dollar spent on email marketing, business owners can expect an ROI of an average of 42 USD. This indicates that if you write a compelling email and segment your audience properly you can surely increase your rate of interest.
    • About 81% of SMBs use email marketing for customer acquisition.
    • 80% of retailers said that email is the biggest source of customer retention for them.
    • 99% of email users tend to check their email every other day, with some checking 20 times a day. Out of these people, 58% check their email first thing in the morning.

    Thus, emails are an integral part of people’s lives and the statistics above clearly show why you should care about email marketing. Now, we will discuss email marketing statistics for eCommerce from the perspective of different segments.

    WIDGET: leadform | CAMPAIGN: undefined

    Email Marketing Statistics for ECommerce in 2022

    Number of Emails Sent and Received Per Day Worldwide from 2017 to 2025
    Number of Emails Sent and Received Per Day Worldwide from 2017 to 2025

    Email marketing is an essential component of the success of an eCommerce business. The following are some of the most important statistics for eCommerce in 2022:

    Personalization and Segmentation Statistics

    Writing generic subject lines and email copy won’t get any eCommerce business more clicks rather you might end up in the spam folder. You need to write emails that are tailored according to your target audience’s needs. So, an important thing to get the most out of email marketing is to focus on personalization and segmentation of the emails as per the audience as it can increase click and open rates. The following stats show the importance of personalization and segmentation in email marketing:

    • Emails with a personalized subject line have 50% higher open rates. When talking about personalization most people just think about inserting the name of their customers in the subject line. Well, this is a great tactic, you can also narrow it down further by targeting their age group, demographics, hobbies, and desires. This will help you to string a direct connection with your audience.
    • In tune with this, 88% of email users said that they will reply to an email if they know that the email is specifically written for them. This shows that you need to make your readers feel special.
    • Emails that target the hobbies of the users, generate an open rate of 27.35%. One can conduct quizzes or surveys to find out the likes and dislikes of the target audience.
    • Ecommerce brands that used segmentation in their email marketing strategy witnessed a hike of 760% in their revenue.
    • Once the user has made their first purchase or created an account on your store you should send a welcome email to them. Many of you might think that nobody reads welcome emails but, a recent study found that 82% of consumers open welcome emails.
    • 15.8% of all the emails end up in the spam folder. To avoid this make sure that there are no spam words present in the email copy and subject line. Also, it is important to follow the rules of the CAN-SPAM Act.
    • According to the email users, they don’t like the following things in personalization:
    1. Recommending products and services that don’t match their needs (34%).
    2. Inappropriate season or location offers (14%).
    3. Expired offers (24%).
    4. Already purchased promotions (13%).

    After writing a perfect email your job is not over yet. You need to send emails at the right time and the right day to make sure that your recipients read the email so that your eCommerce business gets the most out of its email marketing strategy.


    How To Manage Your Email List With these Easy Email List Management Software
    Email marketing is one of the most effective marketing techniques and managing an email list can feel tedious. so here are top email management software.


    Best Time and Day to Send Emails Statistics

    Sending the emails at the right time and day can increase your open rates. Here, are some interesting statistics that will help your eCommerce brand achieve the maximum open and click rates:

    • The best time to send emails is 8 AM followed by 1 PM, 4 PM, and 6 PM.
    • Monday has the highest email open rates (22.0%).
    • Although, Tuesday gets the highest click-through rates (2.4%).
    • Wednesday and Tuesday received the highest click-to-open rates (10.8%).

    What is the difference between the open rate and click-through rate?

    In simple words, the open rate refers to the total number of people that simply opened your email whereas the click-through rate refers to the percentage of people who completed the desired action in your email against the total number of people who opened it.

    You don’t need to mandatorily stick to these times and days only. You need to understand who is your target audience, what their day looks like, when they are working and when they are free. You need to send emails on different days and times to understand which day and time works the best for your eCommerce business.

    Email Open Rate and Click-Through Rate As Per Days of The Week
    Email Open Rate and Click-Through Rate As Per Days of The Week

    Visual Content in Email Statistics

    Nobody likes a vanilla-style email. Instead of just plain texts, you can pack your email copy with exciting images, videos, and even emojis. The following are some of the important statistics about visual content in email marketing:

    • 68% of millennials love emails that contain emojis, GIFs, and stickers.
    • Emojis in the subject lines have a 56% higher open rate. So, you can use different emojis that match your brand’s voice for effective marketing.
    • According to Forrester, adding a video to your email copy can increase your CTR by 200-300%. This shows that users love receiving information in the form of videos.
    • Even if you just insert the word ‘video’, you can increase your open rates by 19% and CTR by 65%.
    • Emails that have some kind of image witness an open rate of 27% and CTR of 4.5% than that of plain text-based emails (20% and 3%).

    Mobile Optimization Statistics

    Most people access their apps via mobiles. This is why it is extremely important that you optimize your emails for mobiles otherwise you can lose your subscribers. Below are a few of the email marketing statistics for eCommerce that show the importance of mobile optimization:

    • 59% of millennials use mobile phones to check their emails.
    • 67% of the Gen Z check their email inbox on mobiles.
    • 42.3% of email recipients will delete your previous email if they are not able to read the email properly on the mobile. This means that you need to format your emails properly and make them mobile-friendly always.

    Top 10 Best Email Tracking Tools and Software 2022
    Want to track your emails? but can’t find any reliable email tracking software. Here are some of the best email tracking software to use in 2022.


    Email Automation Statistics

    Email automation is another great strategy that can save your time, increase open rates and click-through rates, and thus, ultimately help you grow your revenue. The following are some important email automation statistics:

    • Brands that use email automation can save 30% of the time.
    • Automating your emails leads to 22% higher lead generation.
    • Automated emails generate 17% more revenue than non-automated emails.
    • Triggered emails generate a higher open rate of 70.5% and witness a 152% higher click-through rate than generic emails.
    • Brands send the following types of emails using email automation tools:
    1. Welcome emails (47%)
    2. Promotional emails (46%)
    3. Transactional emails (28%)
    4. Invitations and reminders (27%)
    5. Blog updates (26%)
    6. Upselling emails (23%)
    7. Event-triggered emails based on customer lifecycle (15%), etc.

    Conclusion

    In order to boost the email marketing strategy for your eCommerce business, first understand the needs, hobbies, demographics, and pain points of your target audience to write a compelling email. Use personalization and segmentation to boost your open rates and click-through rates. Don’t just send a plain email. Instead of sending plain emails, add videos and pictures in your email copy. You can even add emojis in your subject lines. Optimize your emails for mobile and use email automation to boost your revenue.

    At last, use A/B testing to find which version of your email are having the best results as A/B testing can increase your email marketing ROI by 37%. Thus, the above-mentioned statistics are sure to make you understand the value of email marketing and make the best out of it.

    FAQs

    How many emails are sent a day in 2022?

    The data shows that the number of emails sent a day crossed 319.6 billion in 2021 and the figure rose to 333.2 billion in 2022.

    What role does email marketing play in a successful eCommerce brand?

    Email marketing plays an important role in lead generation in a successful eCommerce brand. A targeted email list helps to attract potential customers and convert them into leads.

    How do you calculate ROI in email marketing?

    You can simply calculate ROI in email marketing by dividing the net revenue gained (from your emails) by your total email marketing cost.

  • Valentine’s Day – The Much-Coveted Love Story of Numbers and Statistics

    So, that day of the year is finally around the corner when friends, families and individuals celebrate love, compassion, and relationships with their loved ones. It is not just another celebration, or simply a special day as one may think it is, but this day has quite a significance when it comes to business and economics, globally. It is a revenue-driving force in many essential sectors across the globe and this blog is a testament to what Valentine’s day promises to be – for the gifting industry and anything that connects to it.

    From flowers to jewelry, and from teddies to clothing, the numbers speak a different story about the importance of Valentine’s day and its impact on economies.

    So, let’s take a dive into the Valentine day facts and stats along with some eye-catching business statistics:

    Valentine’s Day Sales – A Dive into the Number Game (USA)
    In the US Valentine’s Day Scene – In Depth Analysis
    Valentine’s Day Predictions 2022 – Pandemic, so what?
    A 360-Degree Overview Of Valentine’s Day
    From the Indian’s Point Of View – The Growing Significance

    Valentine’s Day Sales – A Dive into the Number Game (USA)

    Here’s a list of some of the major Valentine’s day consumer insights that is simply interesting to know:

    • $21.8 billion – yes, that is what the Americans spent on Valentine’s Day 2021.
    • $4.1 billion – worth of jewelry was bought by US consumers on the eve of Valentine’s Day 2021.
    • $164.76 per person – The average amount spent on Valentine’s Day per person in 2021.
    • $106.22 – The average amount spent by women on Valentine’s Day.
    • $291.15 – The average amount spent by men on Valentine’s Day.

    As per the recent Valentines day spending statistics, this year’s (2022) Valentine’s day spending is expected to reach $23.9 billion.


    Valentine's day business statistics
    Average spent by Men and Women on V-day

    In the US Valentine’s Day Scene – In Depth Analysis

    1. Americans spent $27.4 billion on Valentine’s Day in 2020 which was a huge surge, an increase of 32.36% to be apt, the $20.7 billion spent on the same in 2019 seemed like a smaller and outdated number, thanks to the growing need to display their affection among Americans. The numbers dipped a little to $21.8 bn in 2021.
    2. An increase in YoY increase in average spending has become a trend over time, on top of a healthy increment in the spending pattern of an average person on the verge of Valentine’s Day. The statistics show that there has been a more than 43% increase in the spending pattern from 2017 to 2020, which is quite impressive.
    3. 52% of the total expenditure was on spouses and partners, a steady 9% decrease in the expenses as compared to the previous year. This reflects a paradigm shift in the mindset of the millennials who are gradually opening up to spending on family and friends as well.
    4. 1/4th of the US bought something for their beloved pets, which makes up for a very interesting stat and a welcome figure, to top everything else. $1.7 billion was spent on buying gifts for their furry friends, an all-time high in the history of Valentine’s day.
    5. Americans and their love for jewelry and dinner dates were evident in the numbers themselves. $5.8 billion was spent on jewelry, which remained the go-to gifting choice for 21% of the consumers. Over one-third of the Americans who celebrated the day, preferred a dine-out with their loved ones.
    6. Red roses and candies remained the medium to express love & gratitude for Americans who spent $2.3 billion on flowers and plants that make up a healthy 37% of the total consumers. More than 50% of the total consumers bought candies too, nearing 36 million pounds of chocolate for Valentine’s Day.
    7. Men spent more to buy things for their partners and loved ones and it comes as a no-brainer since that has for long, been the case when we consider the numbers side by side. Men spent $26.05 billion on Valentine’s, compared to $23.92 billion spent by women, an 8.90% deficit which could’ve put them on par with men had they spent more.

    Best Products to Sell for Valentine’s Week
    Valentine’s Week is going to begin in from 7th Feb and will continue till theday of love,14 February. Valentine’s week is the week for people to celebratelove and lovers come together to celebrate this occasion. Valentine’s week is also a week for producers and companies to launch their bestprod…


    Valentine’s Day Predictions 2022 – Pandemic, so what?

    Valentine’s Day Predictions 2022
    • $23.9 billion – yes, you heard it right! 3 out of 4 people involved in this day feel that celebrating this day is important. If you think that they’re just saying for the sake of it. NRF predicts that despite everything that the pandemic has spoiled in the US, over 73% of the people think that celebrations are important, courtesy – of the COVID-19 pandemic. The previous year 2021 saw the Americans spending close to $21.8 bn even amidst the pandemic woes and this year it is expected to be somewhere around $23.9 bn, making it the second-highest year on record.
    • $11.7 billion – the significant other/spouse will be showered with appreciation, love, and gifts. The prime purpose for the celebrations, they make up more than 50% of the total expenditure.
    • $5.2 billion – people in the US will spend upon family members and friends which comes as a welcoming statistic because, at the end of the day, Americans do realize that the day is to show gratitude to anyone you love or admire.
    • $4.8 billion – to be spent on children, classmates, teachers, pets, co-workers, and others. The numbers are significant when we compare it to the previous year, which even if low, are important because the world is recovering from the wrath of COVID-19.
    • $175.41 is the expected average amount to be spent by the Americans on this Valentine’s day 2022. The average amount spent by a single person in America was $164.76 in 2021.

    Top 6 Marketing Ideas on Valentine’s Day for your Business
    Isn’t this the exact same time when shops, businesses begun to close down lastyear? Oh yes! What a tumultuous or rather exceptional year 2020 had been. Onefull year since the global pandemic hit India, and finally we’re on the road torecovery… and so is the economy. Businesses are showing signs …


    A 360-Degree Overview Of Valentine’s Day

    360 Degree overview of Valentine’s day
    • As of now, in the US – Valentine’s Day is a  $27.4 billion industry, that is promising enough to grow YoY until the COVID-19 pandemic led to the global slowdown that will be reflected this year.
    • In Australia, AU$377 million is spent on presents, whereas New Zealanders spend $216 million on Valentine’s week shopping.
    • Almost 151 million greeting cards are exchanged on the V-Day.
    • Red roses, which are considered as the symbol of love and remain extremely popular during Valentine’s Day – are grown and sold in large numbers. In 2019, approximately 224 million roses were sold where a dozen of them were priced around $97.22, registering a 2.5% YoY increase.
    • Chocolates, cards, and jewelry remain the most sought-after gifts on Valentine’s Day.

    How Profitable Valentine’s Week are for the Companies?
    Valentine’s week, the week to celebrate love and to be all loved-up andmushy-gushy, Valentine’s day is about gifts and celebration. It is a great timefor couples to celebrate their love using materialize gifts. Valentine’s week isa great time for companies to selling and earning great profits. Th…


    From the Indian’s Point Of View – The Growing Significance

    • INR 30 Crore worth of rose stems were exported from India in 2019.
    • E-commerce transactions are expected to stay somewhere around 20-30 Crores for V-Day.
    • Women spent 35% more than men, a complete opposite when compared to the US.
    • Roses, chocolates, and cards remain popular, in India as well.
    • 50% Y-o-Y growth registered in the starter premium segments when it comes to gifting.
    • INR 5k-10k is the average amount spent by Indians on the eve of Valentine’s Day.

    Valentine’s day Facts & statistics

    On a final note, Valentine’s day holds a special place for consumers and people across the globe owing to the roots of love, compassion, and empathy it vibes for. However, it holds even more importance from an economic point of view since a number of industries are directly or indirectly dependent upon this day for all of their business and revenues. The gifting industry is one of the main industries largely dependent upon this day for their operations and revenues. Despite the pandemic, the V-Day market promises to grow over time, irrespective of the temporary slowdown that we are witnessing nowadays.

  • How much does Market Research cost?

    Big companies deal with many sectors and have the constant need to improve and try new things to keep their consumer engaged. Not only large tech companies but developing ones also spend on market research. They spent on research because of two reasons:

    • Businesses have to be innovation-focused. Working in a constantly changing marketplace, they use research to test new technologies and try to satisfy the customers.
    • Companies have resources, which simply is the reason to research more.
    Steps of Market Research

    All organizations would benefit from having a solid market research practice, but startups don’t have the money or staffing resources to dedicate to intense market research, and companies with mature products often don’t feel a market pressure to spend money on changing/staying ahead of the curve.

    How much do companies spend on Market Research?
    Why is Market Research important?

    Conclusion
    FAQs

    How much do companies spend on Market Research?

    It depends on multiple things. Some of the insights are Qualitative Research and Quantitative Research.

    The total amount spent by companies on market research in 2015 was $68 billion worldwide. The biggest market research spenders by industry are as follows.

    • Consumer Non-Durables, 23% of the total
    • Media and Entertainment, 15% of the total
    • Pharmaceutical, 13% of the total

    Others like Government or Non-Profit Organizations (8%), Financial Services/Bank (7%), Telecoms and Wholesale/Retail (5%), Consumer Durables (4%), Research Institutes (3%), Automotive (6%), Advertising Agencies (2%), Utilities (1%), Other (8%).

    Marketing-driven companies spend much more than product-driven companies. Companies like Unilever, Coca Cola, PepsiCo, etc. spend a few hundred million dollars per year on Research. These companies have a massive number of consumer brands, and the product does not change or update very often. Marketing and sales are key aspects of success, and insights can make a large difference in the business.

    Similarly, success for media and advertising companies depends on reaching a particular number of consumers, so insights into their habits can make a huge difference for their effectiveness (e.g. message, channels used, time spent). However, even if you look at the biggest spenders, it is still significantly less than 1% of their annual spending.


    Sigmetic – Startup that lets you Explore the Trends of your Software Team!
    In the world of modern software development, the expectations of the softwareproducts we use are getting increasingly higher, and the demands on the team’ssoftware development process are increasing proportionally. In a world where distributed teams and remote work is here to stay, it is alsoof …


    Most big companies (1000 employees+) drive 80%+ of the spending.

    Market research tends to be expensive if one does it with agencies, and low-cost / DIY alternatives (e.g. Google Surveys) tend to require trained people that few smaller companies have, otherwise they lack the quality to inform decision-making.

    Top Companies Spending on Research and Development
    Amazon $42.74 billion
    Alphabet $27.57 billion
    Huawei $22.04 billion
    Volkswagen $13.8 billion
    Samsung $18.75 billion
    Intel co $13.56 billion
    Microsoft $19.3 billion
    Apple $20.161 billion
    Roche $10.8 billion
    Johnson & Johnson $12.2 billion
    Toyota $10 billion
    Ford $7.1 billion
    Facebook $18.45 billion
    Merck $10 billion
    Novartis $8.5 billion
    BMW $8 billion
    General Motors $7.3 billion
    Honda $7.1 billion

    Why is Market Research important?

    R&D is the necessary and initial phase of any process leading to technological innovation or market expansion. Research embodies a company’s long-term vision and its strategy when innovation operates more in a short-term economic model of the company.

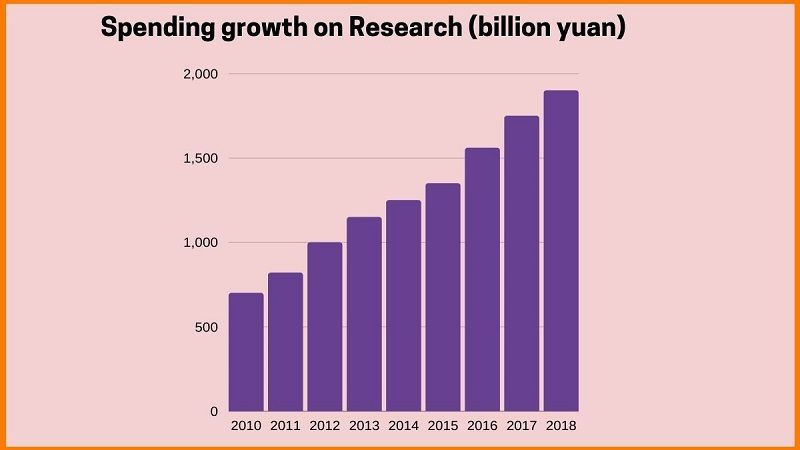
    Spending growth of Organization on Research
    Spending growth of Organization on Research

    Research and development consist of investing money/resources to find innovative products, services, or processes that will enable the company to earn some goodwill and new technologies.

    The experience and the knowledge accumulated by the companies due to R&D activities enhance innovation for any given company. At the end of the day, market research investment will allow the companies to gain in technology and future capabilities that would be eventually convertible into new products, processes, and services. Some of the gains of Research and Development are –

    Finance

    If the companies are conducting their R&D activities to reduce manufacturing costs and improve the system, it provides them with the solutions with less costly processes to manufacture the product and therefore provide more competing prices to the customers or increase their profit margin.

    When the companies are looking to raise funds, R&D activities provide good opportunities to prove the company’s vision to their potential investors. By showing the investors that the company has the right structure to innovate constantly will make them understand that the company has everything it needs to meet sustainable growth. Investors are looking to invest in companies having a proactive approach of finance to manage their business, the constant investment in R&D will prove them the company has quite potential.

    Patents

    Through Research and Development activities, your company can acquire patents for new products you have previously developed. It can help gain a set of sustainable competitive advantages and position the company in an extremely comfortable situation within your market and therefore benefit from long-term profits.

    Recruitment

    Talented and skilled ones are also attracted via recruitment to innovative companies doing exciting things and providing exciting opportunities. With R&D activities, the companies will attract several qualified candidates to join.

    Conclusion

    Research and development have no guarantee of profits, companies spend a lot of time and sacks of money that sometimes turns into nothing. R&D is vital for many companies as they use it to expand their market share and increase sales. The top Research and Development spenders on this list have made a difference on the market, providing new technologies and products that have changed lives and the way the market worked.


    EdpowerU Success Story – Corporate training, skill development and leadership development programme
    One’s workplace behavior has a lot to do with one’s performance and progress atworkplace. How you deal with your colleagues and team, how you handle stress,your decision making power or your creative skills and innovative thinking,everything plays a crucial role in your career. While traditional…


    FAQs

    What is market research in business?

    Market research is an effective tool to assist your business planning. It is about collecting information that provides an insight into your customers’ thinking, buying patterns, and location.

    Why is market research important for a business?

    It is important because it can identify how customers and potential customers might view your business and identify gaps in customer expectations. This is powerful information to have when completing your marketing strategy.

    How much do companies spend on innovation?

    On average, firms tend to spend 1-2% of turnover on various innovation-related activities, but this share exceeds 5% for large firms in some countries. R&D usually accounts for around one-half to two-thirds of all innovation expenditure, but the share varies widely by sector and firm size.

    How much does Market Research cost?

    The price for quantitative research can range widely, from $15000 to over $100,000, with most studies in the $30000-$55000 range.

    What percent do companies spend on R&D?

    Mostly, companies spend between 5-20 % of their annual revenue.

    How much does the average company spend on research and development?

    A company on average spends merely 2%-3% of their revenue on research and development.

    Why R&D is important?

    It is important in many senses like analyzing your target audience, competitors, recent trends, the reaction of consumers towards changing technology, etc. It minimizes the investment risk.

    How is the R&D ratio calculated?

    The price-to-research ratio is calculated by dividing a company’s market value by its last 12 months of expenditures on research and development.

  • Stats about Women Workforce in Corporate India

    We find all sorts empowering posts flying around social media when women’s day is around the corner. No, this article isn’t going to talk about the same old mediocre state of women in the Indian ecosystem. Well we’ve certainty risen above that. We are rather going to be talking about how the women workforce is at it and shattering the society glass ceiling and climbing the corporate ladder one step at a time.

    Although social media tries to push the feminine button a dozen times, what we know is a drop in the ocean. The state of Indian women in corporates is notably growing but the pace is that of the tortoise who wins slowly and steadily.

    It is safe to say we have come a long way from assuming that women were only confined to kitchens and producing babies. Especially in India, where so many women have little to almost no agency to take career oriented decisions, corporate offices still experience male dominance.

    How many Women work in Corporate India
    Women in Indian Parliament
    Stats Around the Globe
    Reasons for declining numbers of Female workers in India
    FAQ

    How many Women work in Corporate India

    According to the Fortune 500 list published in march 2020, only 29 Indian companies had women at senior management and executive levels. The number has grown by a measly 6% in the past decade. Today, women own around 20% of micro scale business in urban and rural parts of the country.

    In July 2020, more than 1.3 billion people will have lived in India. Women constitute 48% of this large figure. Women account for 19% of India’s total labor force. Around 3.8% are CEOs and Managing Directors of listed companies in India. This number has seen a slight uphill from 3.2% in 2014.

    Whereas only 8% women are found to be in top management positions, 13.8% women are board of directors in companies listed on the NSE. Chief Human Resource Officers, a global domain where countries like the US and South Africa overrule positions, and India is still trying to reach a mark, women attributes are only 30%.


    Ghazal Alagh, Co-founder, Mamaearth, On Women Entrepreneurship
    The history of International Women’s Day dates back to 1908, when some 15,000women marched on New York City in the name of better working hours, fairer pay,and the right to vote. Three years later in 1911, the first official IWD wascelebrated throughout Europe as more than a million women walked …


    According to Fortune magazine, Listed below are the top 10 women in corporate India who are shattering the corporate glass ceiling

    • Nita Ambani- Non-Executive Director, Reliance Industries, Co-owner, Mumbai Indians
    • Zia Modi- Co-founder, AZB & Partners
    • Kiran Mazumdar Shaw- Executive Chairperson, Biocon
    • Suneeta Reddy- Managing Director, Apollo Hospitals Enterprise
    • Renu Sud Karnad- Managing Director, HDFC
    • Samina Hamied- Executive Chairperson, Cipla
    • Vinita Gupta- CEO, Lupin
    • Kallie Puri- Vice Chairperson, India Today Group
    • Ashu Suyash- Managing Director and CEO, CRISIL
    • Roshni Nadar Malhotra- Chairperson, HCL Technologies

    Smita V Krishna has been named the richest women in India with a net worth of 434 billion INR and Kiran Mazumdar Shaw was named India’s richest self made women and was ranked third in the overall ranking in 2019.

    While we cannot stop raging about how Indian women are reigning top positions, we cannot forget the dip in the total female labor participation. One would rejoice as the country’s GDP has grown over 6% from 2014 resulting in more employment opportunities, but there has been a considerable decline in the rate of female labor participation, from 42% in 2005 to 23% in 2018.

    It is as if half the female workforce just dissolved themselves. This could be a huge concern to the Indian Ecosystem, since it has abundant labor power and according to one estimate, India has the potential to grow its GDP by $2.9 trillion USD by 2050.


    What prejudices do women face as entrepreneurs?
    Women in Entrepreneurship! Even after 73 summers of independence, this phrasepleasantly raises a few eyebrows. And the ‘pleasantly’ that I added before theraise doesn’t sound as pleasant as it should be. Rather, it is a matter ofconcern for our country. According to a census, women make only arou…


    Women in Indian Parliament

    In 2019, only 78 of 542 seats in the lower house of the Parliament were filled by women. This is a record high figure. However, this percentage amounts to only 14% which is still a long way from equivalence.

    Strength of Women in Lok Sabha
    Strength of Women in Lok Sabha

    Stats Around the Globe

    The global participation of women in senior management has grown to 29%, the highest number ever recorded. In 2020, it maintains the status quo. 87% of global mid-market companies have at least one woman in a senior management role in 2020.

    The women employees seem to crowd the areas like administration and support functions, while men are deep into Operations, R&D, P&L, qualities that are often reviewed for positions for CEO and Board of directors. Around the globe, 40% of women are Human Resource Directors, 17% are chief marketing officers and 16% are Chief Information Officers.


    The Challenges Women Face as Entrepreneurs
    For a long time now, Bollywood and the storybooks have been raking mullahsthrough selling the idea of a fairy-tale. Something that’s so deeply rooted andthen marketed in and around women that many have started believing that afairy-tale is the ultimate destination for a woman in our country and e…


    Reasons for declining numbers of Female workers in India

    Although Indian women are resiliently grabbing a chance at education, it seems that not many of them are looking forward for paid work. As said earlier, women, especially married and from rural towns, have no agency when it comes to the decision of taking up a paid job.

    Many families believe that men are the primary breadwinners. This assumption is keeping women devoid work and are confined to schooling kids at home and taking care of the elderly. The gender roles are so engraved in our society that women are calling it quits and returning home to take care of their families.

    Apart from this, gender pay gap, sexual harassment and proximity to work are major reasons why female workers don’t engage themselves in paid jobs.

    FAQ

    What percentage of the workforce is female in India?

    19.9% of the workforce is female in India.

    Who is the first woman CEO in India?

    Indra Nooyi is the CEO of Pepsi and ranked as the world’s 100 most powerful women.

    Who is the Highest paid female CEO?

    Lisa Su is the highest paid female CEO according to the Associated Press’ annual report on CEO salaries.

    Who is the most powerful woman in India?

    The non-executive director of Reliance Industries Nita Ambani is the powerful woman in India.

    Conclusion

    India is far from parity when it comes to gender based policies. We have to get better at giving women the agency and opportunities, and in such a way that women don’t hesitate to accept jobs and excel in their fields. Women contribute to nearly half the country’s population.

    We need to believe in the female workforce to accelerate the growth of Indian economy. We hope that more women empower themselves by not just being a meal maker but by becoming a meal earner.

  • These Facts and Statistics will help you optimize LinkedIn better.

    LinkedIn is known as one of the most prominent social networking site for the professionals around the world. These facts and statistics based on LinkedIn will guide you to successfully use the site for your benefits. The users of this platform can create online resume, list out their current and previous job roles, and most importantly their skills and education. This site connects the LinkedIn members to the jobs available based on their criteria. The LinkedIn website also allows its users to be endorsed by other users for their individual skills.

    The members can also further join professional groups that are relevant to their interests. LinkedIn also allows business to create their companies profiles and put out their current vacancies. Giving the members an opportunity to apply for these positions directly through its interface. It also provides a platform for publishing with the thought of facilitating leadership in the business world.

    Company Name LinkedIn
    Headquaters Mountain View, CA
    Founded On May 5th, 2003
    CEO Jeff Weiner
    Employees 16,000


    How to Generate Leads from LinkedIn?
    For many B2B SaaS [https://startuptalky.com/tag/saas/] businesses, LinkedIn isthe place to be. If your product is used by enterprises, mid-market companies oreven entrepreneurs or consultants, it’s very likely that your ideal customer isa regular user of LinkedIn. LinkedIn generates over 80% of B…


    The Demographics of LinkedIn

    Demographics are further divided based on sex, age and geographical location

    The LinkedIn user distribution worldwide.
    The LinkedIn user distribution worldwide.

    Age:

    • 37% of the users are from the age group of 30 to 49 years old, 28% of them are 18 to 29 years old and 24% of them are 50 to 64 years old while 11% of them are above 65 years old and above.
    • While marketers can only reach 12% of people aged 18 years or older with the help of adverts on LinkedIn.
    • 37% of the American adults and 51% of US college graduate are on LinkedIn.
    • Out of the 2 billion millennial globally, 87 million millennial are on LinkedIn with 11 million in decision making positions.

    Sex:

    • 57% of the overall users are males and 43% of the overall users are female.
    • 29%of LinkedIn users are males and 24% of the users are females in an average session.
    • 43% the LinkedIn ads audience is female while 57% of their LinkedIn audience is male.

    Geographical location:

    • LinkedIn is spread out to more than 200 countries while representing 30 companies from all over the world by 2019.
    • 33% of the users come from urban areas while 30% are from suburban and 10% from the rural areas.
    • The countries with the greatest reach are: USA (167,000,000), India (64,000,000), China (50,000,000), Brazil (41,000,000) and UK (28,000,000).
    • More than 70% of LinkedIn users are from outside the USA.

    10 Techniques To Get Noticed On LinkedIn
    LinkedIn has been a great platform for offering jobs to millions of peoplearound the world and has a great user base globally. Founded in May 2003 by ReidHoffman, it’s main aim is professional networking. It creates an Eco system inwhich a person seeking job posts up his or her CV and an organiza…


    User Statistics

    LinkedIn has an overall of 675 million users from all over the world, while 310 million of them are monthly active users. 38.6% of the LinkedIn traffic comes from the countries like US with 38.6% and India with 16.8%.

    Other facts based on the users of LinkedIn
    Other facts based on the users of LinkedIn
    • Out of those 4% of them engage on a daily basis. While most user only spend 17 minutes on LinkedIn per month.
    • According to the study done by Pew Research Center 2018 Social Media Use study, LinkedIn is popular among youth as 50% of the college graduates in the USA are LinkedIn users.
    • 44% of the LinkedIn users in the US take home more than $75,000 per year which about their national medium.
    • Although the US has most LinkedIn users at 167 million, 70% of the LinkedIn users come from outside the US.
    • Linked in has 2 new members every second, but their goal is to reach 3 billion users and also to be the hub for every job posting across the estimated 70 million companies worldwide.
    • LinkedIn profiles that have photos get 21 times more views and 36 times more messages.
    • LinkedIn users spend an average of 10 to 20 minutes on the site regularly; visiting 8 to 9 pages.
    • 122 million users have been invited to an interview through LinkedIn, with 35.5% million getting a job through someone with whom they are connected.

    Indian Startups Funding News [Updated 2020]
    This is an effort from StartupTalky to provide you with a list of the fundingactivities occurring in the Indian startup ecosystem. You’ll find the startup’sdetails, the funding it received, as well as the investors’ information. Thelist is updated on a monthly basis. Interested in receiving mont…


    Financial Facts of LinkedIn

    In 2016, Microsoft acquired the company for $26.2 Billion after recognizing the value of LinkedIn. Since its acquisition, LinkedIn’s Financial have been consolidated with Microsoft’s. However, unlike other social media platform that rely on advertisements for revenue. LinkedIn services are something that users are willing to pay.

    • The annual revenue amounted to almost 6.8 billion U.S dollars.
    • In 2018, it contributed $5.3 billion in revenue. In 2019, revenue increased by 27%.
    • Linked generates more than $454.000 per employee.

    Most of LinkedIn Revenue is generated from three of its main major services

    Talent solutions:

    Before the acquisition of the company in 2016, 65% of third quarter revenue, totaling $960 million which came from recruitment services called Talent solutions. This service helped companies in hiring employees and learning and development (L&D) to the existing employees of the company.

    Marketing solutions:

    This solution provides a platform for the companies to advertise to LinkedIn users. In 2016, it accounted for 18% of the total revenue or $109 million from the combination of advertising to the online marketers and the sale of sponsored updates posted to a target audiences within the members of the LinkedIn feed.

    LinkedIn Premium:

    The four tiers of LinkedIn Premium
    The four tiers of LinkedIn Premium

    A total of LinkedIn users pay for LinkedIn Premium which now has four price tiers:

    • Premium Career – meant for those looking for job opportunities in any field. It includes in mail messages per month and in demand videos, as well as the ability to see who viewed your profile. The monthly subscription fee is $29.99/month and INR 1400 per month.
    • Premium Business – This service gives you additional information about business and unlimited people searches. The business owners, MSME and Startups prefer this as it’s pretty much a pocket friendly option for them. The monthly subscription fee is $59.99/month and INR 1900 per month.
    • Sales Navigator pro – This allows the user advanced search filters, access to different sales tools and the ability to make notes on the user profiles. It is mostly chosen by the companies who lookout for some good quality leads through LinkedIn products. The subscription fee is $79.99/month and INR 3900 per month.
    • Recruiter Lite – This service suggests them the top recruiters especially associated with the MNC’s go for this plan. The main purpose for them is to get a good amount of job application for the opportunities they have. The subscription fee is $119.95/month and INR 5000 per month.

    Magicbricks Success Story | Funding And Investors | Valuation
    Still don’t have a dream home of your own? Want a rental property? “Oops, thisis not in my budget!” Having such issues? Don’t know where to find the bestplace to stay? Suffering from selling issues? Chill! why do you worry? Magicbricks is a platform that would help you find the best Real EstateP…


    LinkedIn Content Marketing Facts

    LinkedIn is the No. 1 B2B marketer because it distributes content at 94%. It makes up more than 50% of all social traffic to B2B websites and blogs. Only 3 million users share content on weekly basis, while 1 million users publish an article on LinkedIn.

    Content marketing done by LinkedIn
    Content marketing done by LinkedIn
    • 97% of B2B marketers utilizes it for their content marketing efforts.
    • The professional content posted gets 15x more content impressions than job postings with 57% consuming content on mobile.
    • 280 billion feed updates are viewers annually.
    • 92% of the B2B marketers includes LinkedIn in their digital marketing mix.
    • If the posts are split into 5, 7 or 9 headings perform the best on the site.
    • The articles titles between 40 to 49 characters perform the best on LinkedIn.
    • The articles perform better without video than compared to the ones that contain a video in them.
    • 45% of marketers have gained customers by using this platform, 65% of the B2B companies have LinkedIn paid ads services to acquire customers
    • 80% of the B2B leads come from LinkedIn then compared to 13% from Twitter and 7% from Facebook.
    • In LinkedIn the content that gets the most shared are the long form of content.
    • It is an effective platform for lead generator and customer acquisition. It is even 277% more effective than Facebook in generating leads.
    • Last but not the least LinkedIn is the most top rated paid social media platform with 76% of B2B content marketers using it.