Tag: big data analytics

  • SaaS Business Intelligence Tools

    In the realm of modern decision-making, the significance of data cannot be overstated. The advent of Business Intelligence (BI) platforms has revolutionized this landscape, providing a means to transform raw data into actionable insights. These platforms streamline the process by facilitating data collection and visualization in a singular, consolidated space. Deloitte’s research underscores the potency of data-driven choices, revealing that companies embracing such decisions are 59% more inclined to act upon their analytics findings and an impressive 77% more likely to achieve their business objectives.

    In the ever-evolving marketplace, a plethora of BI platforms saturates the scene, spanning the gamut from highly technical and intricate tools to intuitive and elegantly simple solutions. Navigating this spectrum necessitates a careful evaluation of your SaaS company’s unique needs, including your data ecosystem, sources of information, and authorized data consumers.

    To guide you on this journey, here we have curated a selection of 10 highly regarded and diverse BI tools. Keep reading to gain deeper insights into these transformative instruments.

    What are Business Intelligence tools?

    Business Intelligence tools refer to applications that proficiently gather and transform unstructured data from diverse origins such as literature, periodicals, documents, and images. These tools subsequently employ queries to distill valuable information from the processed data. Additionally, they play a pivotal role in analyzing data, facilitating its integration into reports and statistical visualizations. The versatility of BI tools extends to encompass an array of data analysis functions, encompassing enterprise reporting, mobile BI, real-time BI, and Software as a Service BI. This amalgamation empowers the creation of interactive dashboards, informative scorecards, and statistical software tailored for immersive data visualizations.

    Advantages of BI Tools:

    • Employees can manage and optimize their Key Performance Indicator(KPI) through various real-time data sources and reports.
    • Monitoring and insights over revenue, losses and employee productivity is another key aspect of BI tools. Be it tracking metrics, alerting pitfalls or KPI analysis, these tools have it all covered.
    • Insights on customer behavior, interactions and feedback, BI tools help identify loopholes and flaws in your services, which can be further customized in accordance to the customers convenience.
    • BI tools enhance efficiency by providing a singular and accurate data source and hence data management is optimized.
    • Inaccurate data might lead to unforeseen repercussions. BI tools provide clean and quality data and hence help in generating precise reports.

    Discover the transformative capabilities, benefits, and key features of SaaS Business Intelligence tools that are propelling businesses toward success in a data-centric era.

    Zoho Analytics
    Microsoft Power BI Pro
    Looker
    Tableau
    Domo
    Sisense
    Oracle Business Intelligence
    MicroStrategy
    Yellowfin BI
    Pentaho

    Zoho Analytics

    Website www.zoho.com/analytics
    Rating 4.4 out of 5
    Free Trial Available
    Platforms Supported Web, Android, iPhone/iPad
    Best For Data Analysis, Business Reporting, Visualizations

    Zoho Analytics -
    Zoho Analytics

    Zoho, formerly known as Zoho Reports, is a self-service business intelligence and analytics tool allowing users to analyze their business data and create reports and dashboards. With this platform, organizational teams of all sizes can produce reports quickly without IT help.

    Moreover, the BI tool employs a simple-to-use assistant, Ask Zia, leveraging artificial intelligence, machine learning, and language processing technologies. Zia enables enterprises to integrate analytics into their strategy and get valuable insights via vital performance indicator widgets and reports. The tool has made it easier for business teams to create reports with its intuitive drag-and-drop interface. Additionally, its cloud-based storage makes it easier for users to share data and reports efficiently.

    Furthermore, Zoho Analytics is a great BI tool for several analytical operations, including gathering and combing data, crunching large datasets, and visualizing reports in the form of graphs, charts, summary views, or pivot tables.

    Features of Zoho Analytics

    • Data Integration: This feature allows business teams to analyze their data from 250+ sources. They can connect their data from files, web URLs, databases hosted in-house or on the cloud, business applications, and more.
    • Data Preparation and Management: With Zoho Analytics, users can access a data preparation and management app named DataPrep, which allows for creating and managing data seamlessly.
    • Visual Analysis: Zoho Analytics offers a plethora of visualization tools, including charts, pivots, widgets, summaries, and tabular views, to create reports and gain insights.
    • Augmented Analytics: Users can leverage technologies like artificial intelligence, machine learning, and natural processing and generation to augment their data analysis and get quick insights.
    Zoho Analytics – Self Service Business Intelligence (BI) & Analytics Software

    Pros

    • With Zoho Analytics, users can access a powerful formula engine to create any type of calculations needed to assist in creating required reports.
    • The BI tool is governed by stringent Security Practices to keep business data safe and secure.
    • Easy-to-navigate smart assistant ‘Ask Zia’ allow the tool to centralize data collection and develop a 360-degree view of a company.
    • Organizational teams can scale the Zoho Analytics tool as the business grows.

    Cons

    • Integrating Zoho Analytics for white-label/embedded use cases can be complicated.
    • The subscription pricing is per user versus per group of 5-10 users.
    • The platform lacks effective customer support.
    • Completely manual input with no smart tools to file forms.

    Pricing Plans

    Plan Yearly Price Monthly Price
    Basic ₹960/month ₹1,200/month
    Standard ₹1,900/month ₹2,400/month
    Premium ₹4,200/month ₹5,200/month
    Enterprise ₹15,850/month ₹19,700/month


    Try Zoho Analytics Now

    Microsoft Power BI Pro

    Website powerbi.microsoft.com/en-in/power-bi-pro
    Rating 4.6 out of 5
    Free Trial Available
    Platforms Supported Web, Android
    Best For BI visualization and reporting for desktop, web or mobile

    Microsoft Power BI Pro - saas bi tool
    Microsoft Power BI Pro

    Microsoft Power BI Pro is the full version of Microsoft Power BI, meaning it provides the complete ability to use Power BI to create dashboards and reports and view, share, and use reports unlimitedly. This business intelligence tool gives users the option and ability to share business data, reports, and dashboards with many other users.

    The Power BI Pro is licensed for each user. For instance, an organization with 20 employees will need 20 licenses of the tool to access its full capabilities. Furthermore, it’s a subscription-based platform costing approximately $9.99 per user per month. The plus point is organizational teams can try the tool for free for 60 days before purchasing the subscription.

    Features of Microsoft Power BI Pro

    • Data Connection: The platform can get data almost everywhere with source connections like Excel, SQL, Text, PDF, Azure, Cloud, CSV, and on-premises data.
    • Data-Driven Collaboration: Microsoft Power BI Pro enhances collaboration by using team commenting. The tool also shares rich data visualizations and distributes findings to internal and external organization members.
    • Power Query and Power Pivot: Users can access Power Query in Excel and Power Pivot to edit the data in Power BI Pro.
    • Custom Visualizations: Power BI Pro has various built-in visuals to help users create dashboards and reports.

    Pros

    • Business teams can embed Power BI visuals into applications (PowerApps, Teams, SharePoint, etc.)
    • The platform allows teams to create APP Workspaces and peer-to-peer sharing.
    • Users can navigate integration with other Microsoft solutions like Azure Data Services.
    • Power BI Pro enables users to share datasets, reports, and dashboards with other users of the same tool.

    Cons

    • The platform doesn’t allow users to share reports and dashboards with non-Power BI Pro users.
    • Power BI Pro has a maximum data capacity of 10 GB per user, much less than the licensed tool.
    • The business intelligence tool has a limited daily data refresh limit of eight times per day.

    Pricing Plans

    Plan Price
    Power BI Pro (Per User) ₹ 785.30/user/month
    Power BI Premium (Per User) ₹ 1,570.60/user/month
    Power BI Premium (Per capacity) ₹ 3,92,257.40/user/month

    Looker

    Website cloud.google.com/looker
    Rating 4.5 out of 5
    Free Trial Available
    Platforms Supported Web, Android, iPhone/iPad
    Best For Data Exploration, Collaborative Analytics, Business Intelligence

    Looker - saas business intelligence software
    Looker

    Looker is a powerful business intelligence platform that helps business teams develop and share insightful visualizations to make informed business decisions. The BI tool is part of the Google Cloud Platform. It offers a user-friendly workflow, customized visuals, collaborative dashboards, and efficient customer support. Looker is completely browser-based, eliminating the need for installing desktop software.

    With Looker, users can easily build a customized data exploration platform that makes their data accessible meaningfully and intuitively for the entire company. The platform leverages Data Modelling Language (DML) and incorporates a predefined framework. Looker helps business teams connect with multiple data sources and analyze data efficiently. Regardless of where business data is stored, this BI platform can allow business teams to access the most up-to-date version of their organization’s data. It’s a one-stop solution to visualize, analyze, and manage data.

    Features of Looker

    • Integrated End-to-End Multiple Cloud Platform: Users can perform data analysis and visualization across Server, Google Cloud, AWS, Azure, SQL, Bigquery, on-premises databases, and more.
    • Embedded Data: The business intelligence tool supports embedded analytics and creates customized data experiences.
    • Advanced Workflow Development: Looker has a sophisticated workflow system allowing users to create reports and send them on a scheduled timeframe.
    • In-Database Architecture: With its In-database Architecture, the platform enables users to skip that ELT layer by directly connecting to their raw data.

    Pros

    • The BI tool offers performant and scalable analytics on a real-time basis.
    • Looker is a browser-based platform, eliminating the need for desktop software.
    • Looker facilitates dashboard collaboration, allowing users to develop and publish out-of-the-box git integrations simultaneously.

    Cons

    • Looker costs more than its alternatives, like Microsoft Power BI.
    • Coding in LookML is unavoidable, making it difficult to use by report developers having minimal experience with SQL.
    • Compared to Tableau, the platform doesn’t facilitate elegant visuals.

    Pricing Plan

    Looker offers custom pricing plans. Please visit official website to contact sales team.

    Tableau

    Website www.tableau.com
    Rating 4.6 out of 5
    Free Trial Available
    Platforms Supported Web
    Best For Data Visualization, Business Intelligence, Interactive Dashboards

    Tableau - saas business intelligence software
    Tableau

    Tableau is a business intelligence suited introduced in the market in 2003. It comprises various products, mainly online data processing, visualization, and presentation tools. With Tableau suite products, users can connect to the data source and then fetch, format, visualize, share, and view data. The business intelligence platform mainly focuses on data visualizations among all these data analysis activities. Moreover, when it comes to use groups, Tableau can be used by data analysts and business users. The platform suite is divided into self-service tools for data analysts and managed tools for business users.

    The plus point is that the analytical interface of Tableau requires almost negligible coding knowledge for data querying and creation. In addition, business teams can use Tableau to share information across the company with the help of dedicated servers. This suite allows users to access a toolset to manage their server, data, and meta-data.

    Features of Tableau

    • Informative Dashboards: The BI tool dashboards combine visual objects, text, images, and many other components to present a comprehensive view of the user’s data.
    • Support Several Data Sources: With Tableau, users can connect to and fetch data from numerous sources, including local files, big data, spreadsheets, relational and non-relational databases, data warehouses, and on-cloud data. In addition, the platform supports several data connections, including Google Sheets, MemSql, Presto, Google Analytics, Salesforce, and many others.
    • Easy Collaboration and Sharing: Users can communicate with each other and exchange data in real time by utilizing Tableau. Data can be shared in the form of sheets, visualizations, dashboards, etc.
    • Advanced Visualizations: The platform allows business teams to create visualizations in the form of bar charts, pie charts, Buller charts, histograms, Treemaps, Gantt charts, Motion charts, Boxplots, and many others.
    Tableau Tutorial For Beginners

    Pros

    • Tableau can support complex computations, data blending, and dashboarding to help users create beautiful visualizations that deliver valuable insights.
    • The business intelligence tool can seamlessly handle millions of rows of data.
    • Tableau Dashboard facilitates a great reporting feature that allows users to customize dashboards, particularly for certain devices like laptops or mobile phones.

    Cons

    • Tableau doesn’t offer scheduling or notification of reports. Therefore, users need to update the data in the back-end manually.
    • The parameters of this BI tool are static and allow users to select only a single value using a parameter.
    • Since Tableau is mainly a data visualization tool, users can process basic data.

    Pricing Plan

    Tableau offers custom pricing plans. Please visit official website to contact sales team.


    Best Cloud Based Computing Business Ideas To Start In 2022
    Cloud computing means accessing a network to store, manage/process the data without actually owning the network or any hardware storage system.


    Domo

    Website www.domo.com
    Rating 4.3 out of 5
    Free Trial Available
    Platforms Supported Web, Android, iPhone/iPad
    Best For Business Intelligence, Data Visualization, Cloud Analytics

    Domo - saas business intelligence software
    Domo 

    Domo is a cloud-based business intelligence tool for large and small enterprises. The platform helps organizations collect and transform raw data stored across one or multiple databases into focused reports, graphs, and dashboards. Simply put, it provides users with direct, simplified, and real-time access to business data enabling business executives to make well-informed decisions with minimal IT involvement. Moreover, Domo integrates with various data sources, such as databases, spreadsheets, social media, cloud-based or on-premise software solutions, etc.

    With this software-as-a-service (SaaS) platform, CEOs and managers can access dashboard-style data aggregators helping them track business operations quickly and painlessly. It started with a theme of connecting all the user’s data at the scale of thousands of connectors and trillions of rows of data. Furthermore, its simple drag-and-drop ELT process aid users in combining and transforming business data without requiring any coding knowledge.

    Features of Domo

    • Reporting and Dashboards: The BI tool boasts 150+ chart types, 7,000+ custom map options, drag-and-drop ad hoc analysis, easily deployed dashboards, content creation, and shareable calculations.
    • Connect Data: With Domo, users can access over 1,000 pre-built cloud and on-premises connectors, custom connections via APIs, SDKs or Webhooks, multi-cloud, federated data, custom connectors, partitioned connectors, and more.
    • Data Transformation: Domo facilitates SQL dataflows (coded data flows), Magic ELT (drag-and-drop ELT flows), interactive dataset views, data science studio, interactive instance catalog, etc.
    • Security and Governance: In terms of security and governance, users can leverage data lineage, flexible security (from GGAC to content-based security with Domo PDP), UI and API-based user management options, trusted attributes, Domo stats, and more.

    Pros

    • Domo is a mobile platform that allows executives to run their business via mobile phones, offering 24/7 data accessibility.
    • Users can integrate data from any source, including Google Analytics, email, cloud CRM, and more.
    • Business teams can directly connect social media data from multiple platforms to Domo to understand their online presence.
    • Domo provides easy access to information necessary for the executives to make well-informed business decisions, regardless of their expertise and knowledge.

    Cons

    • Domo’s UI is not intuitive and simple enough, making it difficult for non-technical users to use the tool.
    • It’s expensive for small businesses.
    • It can be difficult for users to extract data from Domo.

    Pricing Plan

    Domo offers custom pricing plans. Please visit official website to contact sales team.

    Sisense

    Website www.sisense.com
    Rating 4.5 out of 5
    Free Trial Available
    Platforms Supported Web, Android, iPhone/iPad
    Best For BI & dashboard software for multiple, large data sets

    Sisense - saas bi tool
    Sisense

    Sisense is an artificial intelligence-driven business intelligence (BI) software introduced in 2004. The tool is primarily used to simplify and analyze complex data, create visualizations, reports, and dashboards, and discover and share insights with enterprise decision-makers. Its easy-to-use drag-and-drop interface and interactive dashboard make it seamless for non-techies to prepare, analyze, and visualize complex datasets. Sisense infuses analytics into different streams of work business teams are involved in and creates a self-service experience to provide AI-based information to organizations.

    The leading BI platform is ideal for companies with limited IT resources and experience with BIG data. Sisense includes data visualization, AI analytics, and data modeling. It facilitates multiple features like disaster recovery and attack surface monitoring, making it a scalable platform. With Sisense, managers can have a complete 360-degree view of the information across hardware, workstreams, and other infrastructure, enabling quick and informed decision-making.

    Features of Sisense

    • Unlimited Dashboards: Sisense allows its users to create unlimited dashboards that can be easily shared with other users via email.
    • Single-Sign-On Authentication: The BI platform uses Single-Sign-On authentication, reducing password fatigue and increasing user productivity.
    • Tracking KPIs: With Sisense Pulse, users can keep track of the most critical KEY performance Indicators (KPIs) across multiple dashboards and build alerts.
    • Efficient Architecture and Big Data Analysis: The tool’s architecture efficiently uses the CPU, RAM, and disk space, allowing business teams to run Bid Data analysis on economical hardware.

    Pros

    • Sisense is a one-stop BI solution, enabling users to do multiple tasks, from data modeling to complex calculations.
    • The BI tool offers built-in connectors and smooth integrations with various third-party applications, including Excel, Google Adwords, Salesforce, Zendesk, and others.
    • Sisense is a flexible platform as it offers a cloud-based and on-premise option.
    • Sisense uses a columnar database approach, making it easier for the tool’s system to pull big queries.

    Cons

    • The BI tool is too ‘heavy’ in terms of the server’s power and the amount of space and resources the application takes.
    • Sisense’s dashboards only interact on the web.
    • Users can’t share a report with users outside of the Sisense system.

    Pricing Plan

    Sisense offers custom pricing plans. Please visit official website to contact sales team.


    Top Careers in the field of Big Data
    Big data is transforming businesses and accelerating growth of many companies. There is a huge requirement for big data professionals. Here is a list of Top careers in field of Big Data


    Oracle Business Intelligence

    Website www.oracle.com/in/business-analytics/business-intelligence/technologies/bi.html
    Rating 4.1 out of 5
    Free Trial Not Available
    Platforms Supported Web, Android, iPhone/iPad
    Best For Enterprise Analytics, Advanced Reporting, Big Data Integration

    Oracle Business Intelligence Tool
    Oracle Business Intelligence

    Oracle Business Intelligence, also popularly known as Oracle BI, is a unique cloud-based suite that helps small and large enterprises to uncover new insights and make quick, informed business decisions. The platform offers agile visual, predictive analytics, and self-service discovery combined with best-in-class enterprise analytics to facilitate decision-making.

    With Oracle Business Intelligence, business teams can access instant mobile and highly interactive dashboards, just-in-time alerts, powerful operational reporting, strategy management, content and metadata search, Big Data sources, streamlined systems management, and sophisticated in-memory computing.

    The tools offered by the BI platform allow companies to communicate strategic business goals with their departments and track progress with scorecards. Moreover, users can use the solution to access existing data from the system and create financial, production, and interactive reports via key metrics. Oracle Business Intelligence is a comprehensive solution that can help organizations reduce the total cost of ownership and boost the return on investment.

    Features of Oracle Business Intelligence

    • Dashboards: With Oracle Business Intelligence, users can create, view, and interact with personalized dashboards based on their predefined role. Business teams can explore data freely alongside a guided navigation path leading enterprises to new insights.
    • Report Type: The BI platform can help users generate various reports, including interactive reports, ad-hoc analyses, or custom reports, and select from pre-built reports.
    • Big Data: The in-memory processing power of Oracle BI allows users to incorporate bid data sets without integrating another solution. The platform can draw data from several sources, such as Google Analytics, Hadoop, HIVE, etc.
    • Augmented Analytics: The tool leverages machine learning and AI to enhance the user’s experience by streamlining the analytics process.

    Pros

    • The Oracle BI platform lets users access a wide selection of interactive dashboards, graphs, charts, and other visualization tools.
    • The solution allows users to analyze enormous datasets efficiently without technical support.
    • Business teams can set predefined alerts for real-time updates when the system is triggered or scheduled.

    Cons

    • Users report constant issues and bugs to the Oracle Business Intelligence platform.
    • The platform lacks visual appeal.
    • Many users found the platform’s architecture farraginous, with poor customer support.

    Pricing Plan

    Oracle Business Intelligence offers custom pricing plans. Please visit official website to contact sales team.


    11 Unknown Facts About Oracle | 11 Oracle Interesting Facts
    Oracle comes as a powerful tech-based company. It holds a number of unique facts that only a few are aware of. Read here to learn more about it.


    MicroStrategy

    Website www.microstrategy.com
    Rating 4.3 out of 5
    Free Trial Available
    Platforms Supported Web, Android
    Best For Enterprise Analytics, Mobile Business Intelligence, Data Discover

    MicroStrategy - enterprise business intelligence platform
    MicroStrategy 

    MicroStrategy is an enterprise business intelligence (BI) platform with multiple features to help businesses make data-driven decisions and optimize processes. Its product suite includes Embedded Intelligence, HyperIntelligence, Consulting, Cloud, Education, and BI and Analytics tools. Its user-friendly and intuitive tools and capabilities include interactive dashboards, ad hoc queries, scorecards, formatted reports, automated report distribution, and alerts. All these tools let end users and BI professionals perform multiple tasks like data discovery, wrangling, visualization, and big data analytics.

    Users can deploy MicroStrategy’s architecture on premises with Windows or Linux servers or as a Microsoft Azure or AWS cloud service. Moreover, its client interfaces allow users to access the platform via the web, Windows, Mac, or mobile devices. Users can also access a software developer kit (SDK) when utilizing MicroStrategy to customize and integrate an application with other applications. Additionally, the platform contains APIs and gateways allowing users to integrate MicroStrategy functionalities with third-party analytics tools.

    Features of MicroStrategy

    • Data Discovery: The software can connect to and interact with various types of data sources and gather and jumble data from numerous sources to generate insightful reports.
    • Data Wrangling: This feature allows users to transform business data into useful information and modify it according to their needs.
    • Data Mining and Predictive Analysis: MicroStrategy enable users to incorporate third-party data mining and modeling tools and use them to build and design predictive and easily accessible reports.
    • Analytical Functions: The BI platform has a huge library of around 300 functions, like data mining, mathematics, financial, OLAP, etc., that help build strongly interactive and information reports and conduct statistical analysis.

    Pros

    • MicroStrategy has a user-friendly interface, making it easier for users to access and analyze data.
    • MicroStrategy is a highly customizable BI platform that can be tailored to meet the specific needs of organizational departments and teams.
    • The platform is designed to be scalable, enabling small businesses and large enterprises to use it seamlessly.

    Cons

    • The BI tool can be expensive, particularly for large companies requiring multiple licenses and support.
    • Although MicroStrategy has a user-friendly interface, some users find it complex and difficult to use.

    Pricing Plan

    MicroStrategy offers custom pricing plans. Please visit official website to contact sales team.

    Yellowfin BI

    Website www.yellowfinbi.com
    Rating 4.6 out of 5
    Free Trial Available
    Platforms Supported Web, Android, iPhone/iPad
    Best For Enterprise Analytics, Mobile Business Intelligence, Data Discovery

    Yellowfin BI Tool
    Yellowfin BI

    Yellowfin Business Intelligence, also called Yellowfin BI, is an integrated data analytics platform that renders companies with innovative business intelligence tools, including dashboards, reporting, data transformation, and analytical applications. It’s a single integrated solution developed for organizations across varying industries and scaling sizes. Moreover, users can customize the platform to suit businesses in accounting, agriculture, advertising, marketing, insurance, manufacturing, food, technology, and many other fields.

    From insightful dashboards, scorecards, and predictive analytics, to online analytical processing, report generation, and performance management, the business team can access all these key functionalities to make informed business decisions. Moreover, the Yellowfin BI platform facilitates collaboration and storytelling to help businesses reduce the complexity of data analytics. Business teams can better comprehend and analyze data using modern, action-based dashboards. Furthermore, the BI tool is browser agnostic, making it accessible from desktops and mobile devices.

    Features of Yellowfin BI

    • Action-based Dashboards: Users can take their dashboards to the next level with embedded operational workflows via no code or low code development environment.
    • Automated Business Monitoring: Business teams can discover changes and outliers in their data as they occur through threshold-based alerts or automated AI-driven signals.
    • Data Stories: Yellowfin BI can help reduce the time it takes to tell insightful data stories with its rich data visualizations.
    • Management Reports: The BI platform allows users to generate professional data-driven management reports and presentations.

    Pros

    • The platform allows real-time, trend, and predictive analysis, helping users know the market and make good decisions.
    • Yellowfin BI facilitates mobile access, allowing the business team to monitor and collect data at any time and place.
    • The powerful tool enables data visualization in an easy-to-understand format.

    Cons

    • Data extraction can be a bit slow with Yellowfin BI.
    • Integrating the platform with third-party tools can be quite cumbersome.
    • Many users find generating some reports difficult, as it sometimes lags and hangs.

    Pricing Plan

    Yellowfin BI offers custom pricing plans. Please visit official website to contact sales team.

    Pentaho

    Website www.hitachivantara.com/en-us/products/pentaho-platform/data-integration-analytics.html
    Rating 4.3 out of 5
    Free Trial Available
    Platforms Supported Web, Android, iPhone/iPad
    Best For Data Integration, Business Analytics, Big Data Processing

    Pentaho - saas business intelligence solution
    Pentaho

    Pentaho is a commercial open-source business intelligence (BI) tool that helps organizations make data-driven decisions. The platform provides access to data integration, information dashboards, OLAP services, reporting, data mining, predictive analytics, and extract, transform, load (ETL) capabilities. Its data integration functionality allows users to find, manage, and combine data from various sources, such as native support for analytic databases, NoSQL, and Hadoop. Moreover, now that Pentaho is data agnostic, it is suitable for embedding or white labeling visual analytics as a part of third-party SaaS/software applications. Users can rebrand and customize the application based on open standards and architecture.

    Pentaho offers predictive analytics that further facilitates machine learning algorithms, tools to process data, and the capability to import third-party models with PMML. In addition, users can translate big data into sights within this singular platform. The BI tool allows users to access a complete spectrum of data from several sources via its adaptive big data layer, taking the data source into account. Built on open architecture, the software can be integrated with multiple systems.

    Features of Pentaho

    • Reporting: Pentaho Bi reporting tools help generate reports on-demand and according to the fixed schedule set by the user.
    • Dashboard: The dashboard serves as the front face of the platform that offers well-reported content, analysis, and layout.
    • Data Mining: With the data mining feature, users can interact with the data at the graphical and program level for further analysis.
    • Data Integration: The data integration tool possesses various resources in terms of transformation libraries and mapping objects that allow business teams to integrate data across all levels. Moreover, the platform’s data integration templates are reusable.
    Pentaho Tutorial for Beginners

    Pros

    • Pentaho is a highly intuitive and scalable tool.
    • It uses a user-friendly GUI and offers 24/7 technical support.
    • The BI platform is the one-stop solution for ELT, reporting, and analysis.

    Cons

    • The components of Pentaho can be present in a segregated mode.
    • The BI system has a fragile unified interface.
    • Compared to other BI tools, Pentaho technology evolves much slower.

    Pricing Plan

    Pentaho offers custom pricing plans. Please visit official website to contact sales team.

    Conclusion

    In the realm of modern business, SaaS Business Intelligence (BI) tools have emerged as vital assets, seamlessly combining cloud technology and advanced analytics. These tools democratize data insights, enabling real-time access and collaborative decision-making across devices. The diverse array of tools available reflects the unique needs of businesses, propelling them into an era of data-driven strategies. As technology advances, embracing SaaS BI tools becomes essential for maintaining a competitive edge. With data as a compass, businesses chart a course to success that’s both informed and achievable.

    FAQs

    What are SaaS Business Intelligence (BI) tools?

    SaaS BI tools are cloud-based applications that offer advanced analytics and data visualization capabilities to help businesses transform raw data into actionable insights. They enable users to access and analyze data in real time, facilitating informed decision-making.

    How do SaaS BI tools differ from traditional BI solutions?

    SaaS BI tools are hosted in the cloud and accessed through web browsers, eliminating the need for complex on-premise installations. Traditional BI solutions often require significant infrastructure investments and maintenance.

    What advantages do SaaS BI tools offer?

    SaaS BI tools offer several benefits, including lower upfront costs, faster deployment, scalability, and accessibility from various devices and locations. They also often include regular updates and improved collaboration features.

    What features should I look for in a SaaS BI tool?

    Key features to consider include data visualization capabilities, user-friendly interfaces, integration with various data sources, scalability, security measures, and the ability to create customizable dashboards and reports.

    Can SaaS BI tools handle large volumes of data?

    Yes, many SaaS BI tools are designed to handle vast amounts of data.

    Are SaaS BI tools secure?

    Yes, reputable SaaS BI providers implement robust security measures, including encryption, access controls, and compliance certifications, to safeguard sensitive business data.

    How do I choose the right SaaS BI tool for my organization?

    To choose the right tool, consider your organization’s specific needs, such as data sources, user requirements, budget constraints, and scalability. Conduct thorough research, read reviews, and consider trial periods to determine which tool aligns best with your objectives.

  • Axtria: A Software and Data Analytics Provider to Life Sciences Industry

    Company Profile is an initiative by StartupTalky to publish verified information on different startups and organizations. The content in this post has been approved by Axtria.

    Analytics as a service (AaaS) market size was estimated to be $18.9 billion in 2022 and has plenty of headroom for growth and reach $68.9 billion by 2028. In this technologically advanced era, a wide array of cloud software and analytical capabilities exist, transforming how organizations drive data-driven insights in multiple aspects of their business and make informed decisions.

    Axtria, a New Jersey-based big data analytics company, sits at the cusp of this revolution in data analytics. The company provides software and data analytics solutions to enterprises operating in the life sciences industry.

    Let’s dive in to learn more about the company, including its startup story, founders, funding, business mode, growth, partners, and more.

    Axtria – Company Highlights

    Company Name Axtria
    Headquarters Berkeley Heights, New Jersey, United States
    Sector Big Data Analytics
    Founders Jaswinder Chadha, Navdeep Chadha
    Founded 2010
    Valuation $1 billion (2021)
    Website axtria.com

    Axtria – About
    Axtria – Industry
    Axtria – Founders and Team
    Axtria – Startup Story
    Axtria – Mission and Vision
    Axtria – Business Model
    Axtria – Products and Services
    Axtria – Funding and Investors
    Axtria – Growth
    Axtria – Marketing Strategies
    Axtria – Partners
    Axtria – Awards and Achievements
    Axtria – Competitors
    Axtria – Future Plan

    Axtria – About

    Axtria provides award-winning cloud software and data analytics worldwide to the life sciences industry. The company seamlessly blends information, analytics, and technology on the cloud to help life sciences enterprises gain a completive edge to increase sales, boost patient outcomes and drive business growth.

    Axtria serves companies in 100+ countries, including the United States, India, western Europe, the United Kingdom, Germany, Japan, France, and Switzerland.

    Axtria – Industry

    Axtria serves the big data analytics industry which is projected to grow from $271.83 billion in 2022 to $745.15 billion in 2030 at a CAGR of 13.5%. Big data analytics examines databases to understand and deliver valuable insights based on varying market trends, correlations, hidden patterns, and more.

    Size of the Big Data Analytics Market Worldwide
    Size of the Big Data Analytics Market Worldwide

    Industries shifting to digital solutions amid the Covid-19 pandemic to transform digitally has increased the demand for big data analytics solutions. Another driving factor of market growth is the increasing adoption of databases across every industry. IBM Corporation, SAP SE, SAS Institute Inc., Microsoft Corporation, and Oracle Corporation are some major companies operating in the market.

    Axtria – Founders and Team

    Jaswinder Chadha and Navdeep Chadha are the Co-founders of Axtria.

    Jaswinder Chadha

    Jaswinder Chadha - Co-founder and CEO, Axtria
    Jaswinder Chadha – Co-founder and CEO, Axtria

    Jaswinder Chadha attended the Indian Institute of Technology, Delhi, for a B.Tech in Mechanical Engineering, The University of Texas at El Paso for an M.S. in Industrial Engineering, and Texas A&M University for a Ph.D. in Industrial Engineering and Operations Research.

    He co-founded marketRx in 2000 and worked as its CEO till 2009. Currently, Jaswinder is the Board of Directors member at Panjab Digital Library and SpectraMedix. In addition, he holds the position of the Advisory Council Member, SBAAC, at the Federal Reserve Bank of New York and co-founder and CEO at Axtria.

    Navdeep Chadha - Co-founder, Axtria
    Navdeep Chadha – Co-founder, Axtria

    Navdeep Chadha completed his B.Tech in Electronics Engineering from Guru Nanak Dev University and M.S. in Computer Science from The University of Texas at El Paso.

    He worked as Managing Consultant at Noblestar and Co-founder and CTO at the marketRx. At present, Navdeep is the Co-founder of Axtria.

    Axtria has over 2,500 employees globally.


    The Big Data Market 101 Trends, Analysis :Everything you need to know
    the big data analytics market in retail becoming valued at $4.43 billion in 2019, and is calculable to achieve $17.85 billion through 2027, registering a CAGR of 20.4% from 2020.


    Axtria – Startup Story

    Jaswinder Chadha and Navdeep Chadha co-founded Axtria in 2010 after recognizing the opportunity to satiate the imminent need for data-driven analytics solutions in the life sciences industry for managing the ever-expanding volume of data due to rapid digitization and adoption of cloud technology. The co-founders figured out that the key was to provide enterprise-grade analytics on integrated software technologies that could complement the organization’s existing ecosystem.

    Axtria raised its initial funding round from Sequoia Capital in India in 2010. The company expanded into Europe in 2016 and to a spacious San Mateo, California office in 2019. In the same year, it opened a new office in Boston. It was in 2020 that Axtria opened its third delivery center in Bengaluru and a new office in North Suburban Chicago.

    Analytics as a Service (AaaS) Market Size Forecast  Worldwide in 2021 and 2028
    Analytics as a Service (AaaS) Market Size Forecast Worldwide in 2021 and 2028

    Axtria – Mission and Vision

    Axtria is focused on delivering solutions to help clients complete their journey from Data-to-Insights-to A-Action and get higher returns from their sales and marketing investments.

    Axtria – Business Model

    Axtria combines process knowledge of life science commercial operations, data analytics, and technology to help customers make better data-driven decisions. The company uses big data, cloud, artificial intelligence (A.I.), and machine learning (ML) to develop multiple proprietary applications, like RiskIQ, SalesIQ, and MarketingIQ.

    These applications get embedded in the customer platform to deliver crucial insights related to market, operations, sales, marketing, customers, and business risk, at the point of decision.

    Axtria – Products and Services

    Axtria’s product line includes Axtria DataMAx, Axtria InsightsMAx, Axtria SalesIQ, Axtria CustomerIQ, and MarketingIQ. Moreover, its solutions comprise Strategy Consulting, Information Management, Market, Sales, Advanced Analytics, Marketing, Clinical Development, and Therapeutics.

    Axtria Introduction

    Axtria – Funding and Investors

    Axtria raked $206.2 million in funding by raising 6 funding rounds. The company’s latest funding round – Venture Series Unknown Round, was raised on May 13, 2021, to secure $150 million. Some of its leading investors are Bain Capital Tech Opportunities, Helion Venture Partners, Richard Braddock, Sparta Group, and Amanpreet Sawhney.

    Date Round Number of Investors Money Raised Lead Investor
    May 13, 2021 Venture Round 1 $150 million Bain Capital Tech Opportunities
    December 11, 2018 Venture Round $11.5 million
    July 7, 2015 Series C 5 $30 million Helion Venture Partners
    January 6, 2015 Series B $5.6 million
    January 9, 2014 Series A $4.8 million
    January 10, 2011 Seed Round $4.3 million

    Axtria – Growth

    The cumulative growth rate of Axtria from 2017 to 2021 was 30%. The company’s estimated annual revenue in 2022 was approximately $1.1 billion, with $330,310 per employee. Furthermore, its post-money valuation stood at around $1 billion in 2021, and the employee count grew by 29% last year.

    Axtria – Marketing Strategies

    Axtria markets its business by educating its target audience via podcasts, webinars, videos, blogs, and infographics. It launched a new podcast series, “Life Sciences Leadership Podcast,” in June 2021. The episodes featured the company’s Global Head of Marketing, Jasmeet Sawhney, speaking with subject matter experts on several topics impacting the life sciences sector.

    About The Life Sciences Leadership Podcast

    Moreover, in 2023, Axtria announced the launch of another new podcast series, “Leading Minds,” to delve deep inside the ethos of top life sciences executives, including biotech, consumer health, pharmaceuticals, animal health, medical devices, and related industries.

    Axtria usually releases its podcasts on Apple Podcast, iHeart, Google Podcasts, Spotify, YouTube, Overcast, and Stitcher.

    Axtria – Partners

    Axtria has partnered with the following:

    • AWS
    • Knime
    • SalesForce
    • Snowflake
    • IIT Kharagpur
    • HealthVerity

    Axtria – Awards and Achievements

    Axtria garnered honorable recognitions from leading institutes now and then:

    • Named the Only Leader and Star Performer in Everest Group Life Sciences Operations PEAK Matrix Report in 2022.
    • Named in the New York Business 2021 list of Largest Privately Held Companies by Crain.
    • Recognized for High-Trust, High-Performance Culture by the Great Place to Work Institute for the third consecutive year in 2021.
    • Named in the Most Promising Technology Companies Top 100 List by SiliconIndia in 2019.
    • Ranked on the NJBIZ Fast 50 List for the fifth consecutive year in 2018.

    Axtria – Competitors

    Axtria’s primary competitors are as follows:

    • IQVIA
    • ZS
    • Accenture
    • Fractal Analytics Inc.
    • Palantir Technologies Inc.
    • Mu Sigma Inc.
    • Health Catalyst Inc.
    • Vision33
    • TRIUMF

    Axtria – Future Plan

    As of June 2023, Axtria plans to expand its headcount with 1,000+ data scientists, data engineers, and software developers across its offices in India in the next 8 to 10 months. The company is also preparing for aggressive campus hires in the country in two years.

    FAQs

    What does Axtria do?

    Axtria provides award-winning cloud software and data analytics worldwide to the life sciences industry. The company seamlessly blends information, analytics, and technology on the cloud to help life sciences enterprises gain a completive edge to increase sales, boost patient outcomes and drive business growth.

    Who are the founders of Axtria?

    Jaswinder Chadha and Navdeep Chadha are the co-Founders of Axtria.

    Who are the main competitors of Axtria?

    Axtria’s primary competitors are as follows:

    • IQVIA
    • ZS
    • Accenture
    • Fractal Analytics Inc.
    • Palantir Technologies Inc.
    • Mu Sigma Inc.
    • Health Catalyst Inc.
    • Vision33
    • TRIUMF
  • How Do Companies Use Mobile Analytics to Improve Their App?

    Seventy percent of screen time is devoted to smartphones. A large percentage of this time is spent on apps. Such tremendous interest is fantastic news for you as an investor in the technological market. Simultaneously, the mobile app industry is quite crowded. If there’s one app for an issue, there’s probably another (or ten) available.

    How can you remain above the curve while every application in the industry claims to be the next great thing? What strategies do you employ to ensure your software is unique? That’s when mobile analytics come into play.

    What Is Mobile App Analytics?
    Types of Mobile Analytics
    Mobile Analytics versus Standard Web Analytics
    Different Ways Mobile Analytics Is Used by Multiple Departments in a Company
    What Is the Most Effective Technique to Obtain Analytics for Applications?
    Is Google Analytics Compatible With Mobile Apps?
    Best Mobile Analytics Tools

    What Is Mobile App Analytics?

    The collection and assessment of data – the data that makes you learn your customers’ behaviour and how they engage with your app – is called mobile analytics.

    This unlocks a slew of options, such as gaining information about the number of converts and customers, as well as a better understanding of your consumers’ experience within your app.

    Ultimately, it clarifies the objectives of users–do they want to purchase stuff? Is it merely for the purpose of obtaining data? Or are they simply browsing?

    Types of Mobile Analytics

    There are various forms of mobile analytics, each one improving your app in a unique way. To make the most of these mobile analytics sorts, keep in mind your company’s demands and objectives.

    Mobile Advertising Analytics

    You can track the efficacy of your promotional activities using mobile advertisements or marketing analytics.

    App Monetization Analytics

    App monetization analytics can help you learn more about your consumers’ app purchases. With this data, you may devise tactics to increase the profitability of your app.

    In-App Engagement Analytics

    In-app engagement analytics allows you to monitor user behaviour within the app. Learning how your app’s customers engage with it is a great method to constantly improve.

    App Store Analytics

    App store metrics can be accessed via app stores or a 3rd party solution. You may track optimization metrics like:

    • App download and installations with this form of analytics.
    • Rating
    • Earnings
    • Systems
    • Venues

    You may compare your application to your rivals in app stores by employing a 3rd party analytics tools.

    Performance Analytics

    Performance analytics is critical for determining the efficiency of your app. Many consumers will uninstall your app if it doesn’t function properly. You must evaluate all potential permutations of devices, OS, and other aspects to fully comprehend your app’s functionality.

    Mobile Analytics versus Standard Web Analytics

    Let’s look at the differences between mobile analytics and standard web analytics now. On portals, web analytics gather user information. For using web analytics, you must include a JavaScript code snippet in your site’s HTML source code. It’ll then begin collecting info and utilizing cookies to discover web traffic. Web analytics tools keep records of both desktop and mobile visitors’ info.

    Mobile analytics is for smartphone and tablet applications. It tracks data via SDKs rather than prefetching, and customers are identified by their gadget or OS ID. Remember that each OS has its own SDK.

    Moreover, unlike conventional analytics, mobile analytics excludes info from search engines because consumers access apps through their phones rather than through search engines. If your app connects with other apps, certain mobile analytics systems also help track inter-app interoperability. Also, because these elements impact your app, app analytics gives insight into consumers’ devices. Web designers should try and ensure their designs are attuned.

    Different Ways Mobile Analytics Is Used by Multiple Departments in a Company

    To collect data, analytics solutions are frequently connected with organisations’ native applications. It ensures that the time and work put into designing the app does not go in vain. Also, it tells you where your customers are drifting off and what hurdles they’re hitting during the onboarding.

    When it pertains to refining and optimising the UX, the ideas gleaned from analytics data are immediately relevant for various teams within the firm.

    Marketing

    A market study is done using mobile analytics. It allows firms to monitor and assess the efficacy of their marketing efforts, as well as determine which platform is the most effective. This aids in the proper management of your marketing initiatives.

    UX/UI

    Heatmaps and session replay aid UX professionals in focusing primarily on the majority of your app’s user-interacted sections. Heatmap is a data visualisation tool that displays how your smartphone users engage with the UI by clicking, tapping, scrolling, etc.

    Heatmaps
    Heatmaps 

    Session replay recreates the user’s experience in the format of replay clips and accentuates the user’s full touch engagements. This study enables them to carefully position CTAs, improve navigation, and utilise screen features to provide a streamlined experience.

    You may delve deeper into a whole set of users by integrating session replays and conversion funnels and monitoring the deviation and true customer behaviour.

    Product

    A/B testing allows product managers to assess their customers by dividing them into 2 (or more) sets and observing how each variation influences their behaviour. Product managers can use tools like usage monitoring to uncover trends that will assist them to make decisions as they make modifications and send out fixes.

    After taking recourse, product managers must ensure that it has the desired effect. When making judgments, they consider conversion rates, the most frequently utilized screens, app versions, devices, and OS.

    Establishing funnels for certain user groups is an intriguing use case. Using session replays to see into the funnel lets product members discover why a certain customer took a specific function and where they were experiencing trouble. This assists in finding the precise setting of customer drop-offs and other prominent user resistance spots.

    Engineering

    App failures and ANR are two of the most common causes of customer dissatisfaction. Technical experts can employ heatmaps and session replay to monitor crucial usage patterns like anger taps, extended presses, quit touch, and inattentive touches, which signal displeasure.

    Heatmaps assist groups in visualising the stage at which customers become irritated. The mix of session replays and heatmaps reveals the list of steps that users take well before exiting the programme.

    Crash analytics paired with heatmaps enables you to rerun the user’s onscreen activity and discover what caused the crash. This takes away the ambiguity for tech personnel, allowing them to focus on tackling the issue without having to deal with already irritated users.


    Top Analytics Tools for SaaS | SaaS Analytics Tool
    Top Analytics tools for SaaS business are important because if you can’t measure it, you can’t improve it. You need efficient analytics tools that will break down data into understandable metrics.


    What Is the Most Effective Technique to Obtain Analytics for Applications?

    For that, you’ll need to use mobile app advanced analytics. Because each piece of equipment has its range of attributes, you choose something that suits your needs.

    These tools are typically simple to set up and utilise. All you have to do is include SDKs in the programme you wish to track. The programme will begin collecting data constantly so you can keep track of your app. You can quickly acquire meaningful information about user behaviour and the effectiveness of your app using mobile analytics services.

    Create a UX Map

    It depicts the consumer journey using your phone app from the start. You’ll learn which parameters to track and when users often discontinue using your application if you study their experiences. This way, you’ll be able to pinpoint exactly which phases of the user’s journey need to be improved in order to increase income.

    Use it at Each Stage

    Don’t delay until a problem occurs with your application to begin using analytics. It’ll be much simpler to spot and solve issues if you try integrating analytics for your application from the start.

    Determine the Variables You Ought to Monitor

    There seem to be a lot of variables to detect, and if you don’t figure out which ones are most vital to a company first, you’ll waste time and money on the ones that aren’t. As a result, ensure to outline your objectives and then select the appropriate measurements to achieve them.

    Evaluate Your App

    Ensure you check your app in a variety of scenarios to ensure that it meets the requirements. A/B testing is a wonderful way to figure out how to improve your app’s exchange rate.

    Use Tools

    The greatest method to learn how to optimise your app while improving efficiency is to utilize app analytics programs and tools. There are a plethora of mobile analytics systems to select from, so ensure you pick something that’s right for you. However, not every mobile analytics are same. There are several mobile analytics options available. UserExperior, Google’s Firebase, and others are instances of mobile analytics solutions that, while similar, are not exclusive and handle various challenges.

    Qualitative Analytics encompasses previously mentioned capabilities such as heatmaps and session replay and is probably highly recommended for every firm’s stack.

    Early investors of QA Solutions include Lenskart and ICICI Prudential Life Insurance, which have experienced a strong influence on their application service quality and customer loyalty. Replays of sessions and heatmaps are wholly accountable for a 95 percent reduction in service SLA and for repairing the disrupted UX.

    Is Google Analytics Compatible With Mobile Apps?

    Yes, you may utilise Google Analytics tools for phone analytics. Google Analytics for smartphone apps or Google Analytics for Firebase is the two possibilities. You may use services for gratis, but you’ll have to pay to get access to all of the services. It’s a free service provided by Google.

    For Mobile Apps

    You can monitor user behaviour on your portal and apps for free with Google Analytics. You must use Google Analytics SDK for Android or ios to configure analytics for the app.

    It can assist you in two steps:

    • Recognising the most successful lead streams
    • Segregating your app’s customers
    • Monitoring user engagements
    • Analyzing in-app purchase income
    • Analyzing user travel pathways

    Google Analytics gives the following info about your app:

    • Count of users and visits
    • Session duration
    • OS
    • Device forms
    • Users’ residence

    For Firebase

    It’s more than simply an analytics software; it’s also a framework for developing apps. Firebase uses events and variables to record user behaviour. It allows you to update on up to 500 different occurrences at once.

    This utility allows you to accomplish the following:

    • Recording user characteristics and events
    • Configuring unique events
    • Recording in-app purchasing data
    • Creating target markets
    • Seeing real-time user information

    Best Mobile Analytics Tools

    Rather than Google Analytics, you can utilise a variety of additional mobile analytics solutions. Most of them even have additional functionality that Google Analytics does not. They’re as follows:

    1. Countly

    Countly Dashboard
    Countly Dashboard

    It’s an app analytics solution that aids in the enhancement of the user experience. It helps to build unique events to track which activities have the greatest impact on your conversions and retention levels.

    Features

    • Push alerts
    • Crash analysis
    • User ids
    • In-app use metrics.

    2. Localytics

    Localytics Dasboard
    Localytics Dashboard

    It’s a mobile analytics tool that allows you to tailor your app ads in order to boost user experience. This tool aids in attaining better knowledge of your app’s customers so that you can urge them to continue using it.

    Features

    • Funnel analysis
    • Push alerts
    • Event monitoring
    • Retentions monitoring

    3. Adjust

    Adjust Dashboard
    Adjust Dashboard

    It’s a mobile app analytics tool that allows you to analyse how people interact with your app. You’ll be capable of making better marketing decisions and driving profits with this tool.

    Features

    • Funnel analysis
    • Retention monitoring
    • Revenue monitoring
    • Event monitoring

    Conclusion

    When it comes to creating a product that catches the eye, there are a few things to keep in mind. You’ll need a 360-degree view of your app. This ensures that your customer base is committed and satisfied with your brand, and mobile analytics solutions are essential for this.

    FAQs

    What are companies that use mobile analytics?

    Adobe, Clicktale, Google, IBM, and InnoCraft are some of the companies that use mobile analytics.

    What is mobile data analytics?

    Mobile data analytics monitors customer behaviour and helps companies understand how customers are interacting with their apps.

    Why is mobile analytics important?

    Mobile analytics is important as it helps brands optimize their performance and improve their app.

  • Netflix Recommendation Engine – How Netflix uses Big data and Analytics to Recommend you your Favourite Shows

    Entertainment is probably as old as the era of humans itself. We have found out different ways of getting entertained. Some of the sources include dance, singing, playing but some of the most famous and widely accepted ways of entertainment are films, theatrics and movies.

    In this 21st century, as the internet penetrates every domain, it has not left the entertainment sector per se. It has boosted the domain to such heights that it is probably hard to go back to square one. The topmost entertainment provider in the world is Netflix. It uses technology to scale great heights and great revenues.

    There was an old film with dialogue where the protagonist says “A film works only when it has three elements to it, Entertainment, Entertainment and Entertainment”. Well, we as viewers might be tempted to say yes it is true but is it still the same in the twenty-first century? The answer may be a little more than just entertainment. It might include promotions, marketing and more. What more you ask? Big data, Artificial intelligence, machine learning.

    Netflix, the prime entertainment host, do it all to cater to your entertainment needs. We will dive deep to understand how Netflix uses its recommendation engine and how it has incorporated this super-tech to reach new heights.

    A little preface about Netflix
    Personalised Entertainment/Content on Netflix
    Data Analytics of Netflix
    The Recommendation Engine of Netflix
    Business Verticals of Netflix
    Some Facts about Netflix that might Interest you
    FAQ

    A little Preface about Netflix

    Netflix
    Netflix

    Netflix is a streaming service that offers a wide variety of movies, TV series, shows, anime, documentaries, and more. As mentioned, it is a streaming service, so it can be accessed on every possible device. You can stream Netflix via the official website, or its android or IOS app.

    You can tune into it instantly on the web at netflix.com from your personal computer or on any internet-connected device that offers the Netflix app, including smart TVs, smartphones, tablets, streaming media players and game consoles. It is a monthly subscribed service, which you have to redeem monthly.

    There is always something to watch on Netflix. So much so that it has a full library of entertainment. It is extensively built for the best experience in entertainment to its subscribers. That is why Netflix is the most famous streaming platform in the world.

    You might wonder that entertainment is top-notch on Netflix but there is one more thing that it pays huge attention to. The thing is not hideous but is often not much talked about. That one aspect is the library and the whole management of this extensively built personalised library of content.

    Netflix, for years, is able to provide personalised content recommendations to its each and every subscriber. How does it do that? What is the magic behind it? let us uncover that.

    Personalised Entertainment/Content on Netflix

    “If the Starbucks secret is a smile when you get your latte… ours is that the Web site adapts to the individual’s taste.” – Reed Hastings (CEO of Netflix)

    Over the course of the last few years, Netflix has become the favourite destination of people who want to binge on some entertainment films and shows. Netflix started as a humble DVD rental business and it later turned into something totally different as technology kicked in.

    DVD rental business
    DVD rental business 

    We can see the huge subscriber base of Netflix as proof of work and growth. One of the most crucial elements of this growth is personalised content. That crucial element is the underlying asset of the presence of Big Data and artificial intelligence.

    Netflix doesn’t just work in managing content, movies, TV shows and entertainment but it has a lot of other data to handle as well. It has user insights, their data and usage patterns and everything connected to them and of course ‘us’.

    The data management part is not easy at all, especially when you have to constantly change to adapt to your surroundings. Netflix does it so well, no wonder it uses Big data to manage and make sense of huge piles of useful data.

    “Where there is data smoke, there is business fire.” — Thomas Redman

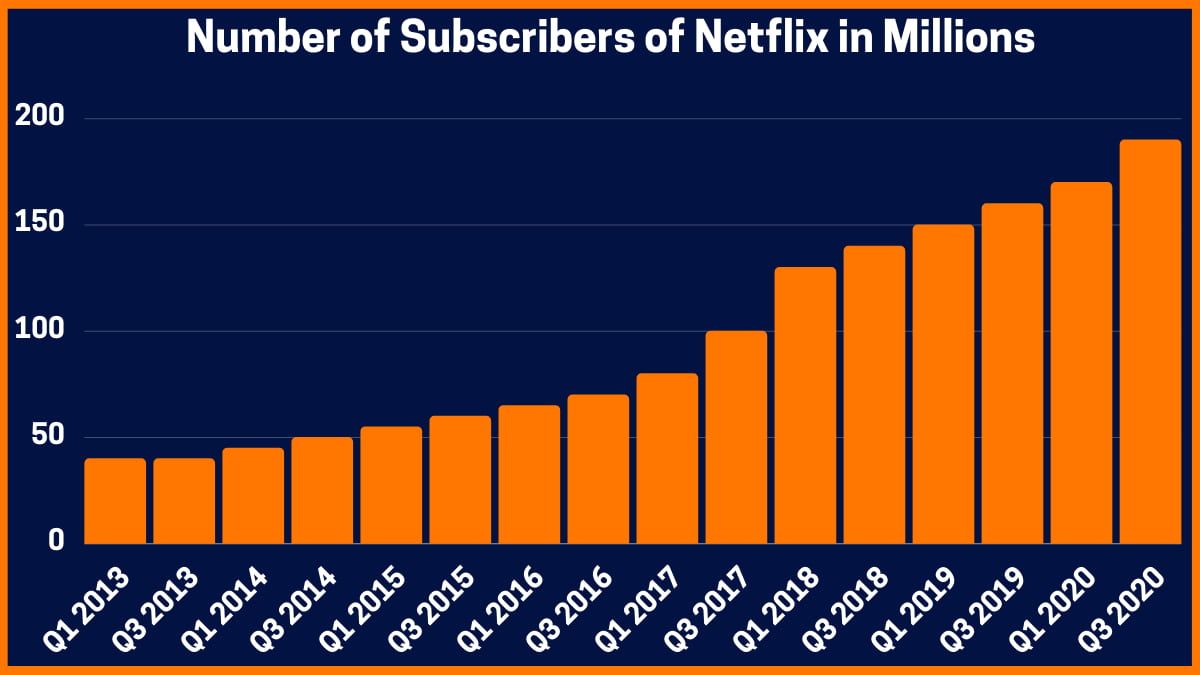
    If we see the graph of Netflix’s memberships and subscriptions, we can see a beautiful upward direction to the moon. The reason is its personalised services and the best user interface that is available out in the whole world.

    Number of Subscribers of Netflix in Millions
    Number of Subscribers of Netflix

    The revenue of this streaming giant is also similar to that of its subscriber base. It has grown steeply and steadily. The reason is the efficiency undoubtedly.

    When it first started as a DVD rental service, it was a quite simple video provider. It used to use mails to provide DVD copies of the content. It was in 2010 when Netflix thought of rebranding and using more sophisticated technology as an aid. They began streaming online and the data that they were collecting grew many folds. This marks many years of anniversary for Netflix as a data-driven company. It has been data-driven even from its very inception.

    Their “Data Analytics’ team work very closely with decision-makers of the company. The data team has useful insights, metrics, predictions and analytics so that everyone can work efficiently. They have to work super closely with the product teams, content teams, studio and marketing teams and altogether with the business operations.

    With the data they collect, they have to perform context-rich analysis to provide insight into their business, partners and of course their subscribers or members. This also enriches the experience for Netflix.


    Shark Tank India: What is it? Who are the Judges?
    The popular business reality TV series has finally debuted in India as Shark Tank India. See who are the judges and will it be a success?


    Data Analytics of Netflix

    When you are dealing with huge amounts of data then efficient data management becomes the reason and a necessary condition for your success. At Netflix, data analytics is the backbone of every work that they do. It is the metric at which they measure their location. It is the basis to know where they are and essentially where they are going. This is where Netflix finds and experiments, it is also the place where they solve existing problems.

    Even from the DVD days, they are a data-driven company first and then anything else. From its inception, they have grown their data department to new heights every now and then.

    As Netflix grew, the need to manage data effectively and efficiently grew too. Every decision is fueled by the data behind it. If you are into any business in the world, you need data to do your best possible job. Netflix does it and it does it quite efficiently.

    Data Science and Engineering at Netflix is primarily and supremely is directed at improving various aspects of the streaming business. Among all the other roles, research applications span many areas including Netflix’s personalization algorithms, content valuation, and optimization for future streaming.

    To maximise the already big impact of Netflix’s research, they do not centralise research into a separate organisation. Instead, they do it within altogether other departments. They have many teams that pursue research in collaboration with business teams, engineering teams, and other researchers. This enables closer partnerships between researchers and the business and engineering in each and every area.

    In addition to that, research that applies to the same methodological area or business area is shared and highlighted in discussion and debate forums to strengthen the work and its impact.

    When we think about big data and Netflix, what comes to mind? More than often you would think that it has something to do with the content recommendation algorithm or the streaming to your personal device. Yes, you are right in most senses, these two topics are the main contributors for data research and analytics but there is more.

    They both are an integral part but there is more to the whole picture. So, further data is used to “make the experience even better than before”. Data has to do a lot with questions like “Which piece of content makes our customers or members most joyous” or “What are some of the areas in which Netflix can collaborate to provide 360-degree entertainment”.

    Data solves the problem of finding the right market fit for the product in any sort of market. Which in turn enhances the user experience of Netflix as a whole.

    The Recommendation Engine of Netflix

    As we discussed previously, data is fuel for Netflix’s smoothness and convenience. The motive is to constantly improve the predictions on how someone is going to react after watching a certain type of movie, genre and another basis. This helps in knowing about the customer preferences, which can be used in future for making better predictions.

    This is when their recommendation algorithm comes into the picture. Netflix has, over the years, designed an algorithm that can suggest recommendations to its users. It is called the Netflix recommendation Engine or NRE. it has been reported that 80% of Netflix viewer activity is driven by personalised recommendations from the engine. Which is a pretty good number for a streaming platform like Netflix. It also saves marketing costs for the streaming giant.

    In Netflix’s case, the NRE or the Netflix recommendation engine has some different factors of inputs. It collects data that will be the most relevant in the prediction of user behaviours. Some of the most commonly tracked inputs are as follows,

    1. The device used to stream on.
    2. The number of searches.
    3. If the show was paused or fast-forwarded.
    4. Whether the entire show/movie was completed watching.
    5. Whether the viewer gave the show or movie a thumbs up or thumbs down.
    6. Scenes that the user replayed.
    7. Time and date at user watched a show/movie.
    8. Profile information such as age, gender, location.

    These are some most used inputs that Netflix recommendation engines use. Moreover, of all the websites that use big data and other predicting technologies, Netflix does it the smoothest. It has been reported that 47% of North Americans prefer to use Netflix with an exclamatory 93 % retention basis. This marks proof of the efficient working of the Netflix model.

    Nevertheless, Netflix is not just winning because of its near-perfect prediction and recommendation technology but also good management. Let us know a little about the business verticals at the heart of this streaming giant.


    Spotify Wrapped: The Successful Viral Marketing Campaign by Spotify
    Spotify wrapped is a viral marketing campaign that has been successful since its inception. Let’s find out how it works and the reason behind its success.


    Business Verticals of Netflix

    What you see is the content and recommendations, well stacked on Netflix, what you do not see is the work that goes behind curtains. There are business verticals/segments that work as a team to improve how we binge-watch content online. Let us read about them in brief words.

    Product

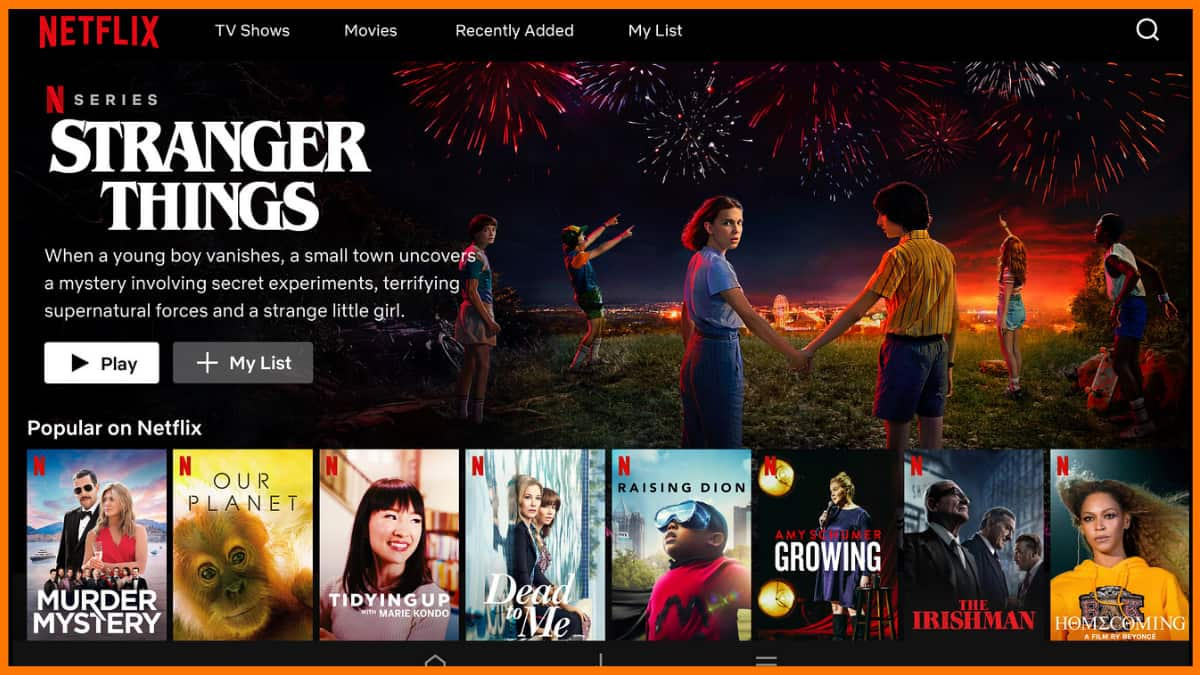
    Netflix Homepage
    Netflix Homepage

    Product is the actual product that the streaming giant is providing. It is the segment that deals with the Netflix app. The motive of this department or business segment is to deliver high-quality streaming, smooth user interface, best customer service. The product segment also has to ensure that the members get the right content recommendations at the right time.

    Content

    The content segment is the cream for the cake. At the heart of Netflix, it also is a content producing company. The content vertical is accountable and responsible for licensing and enabling shows and movies for Netflix. This department also works on all things that can be joyous to the public. Buying decisions at this and all other levels are done by this area of the business vertical.

    Membership

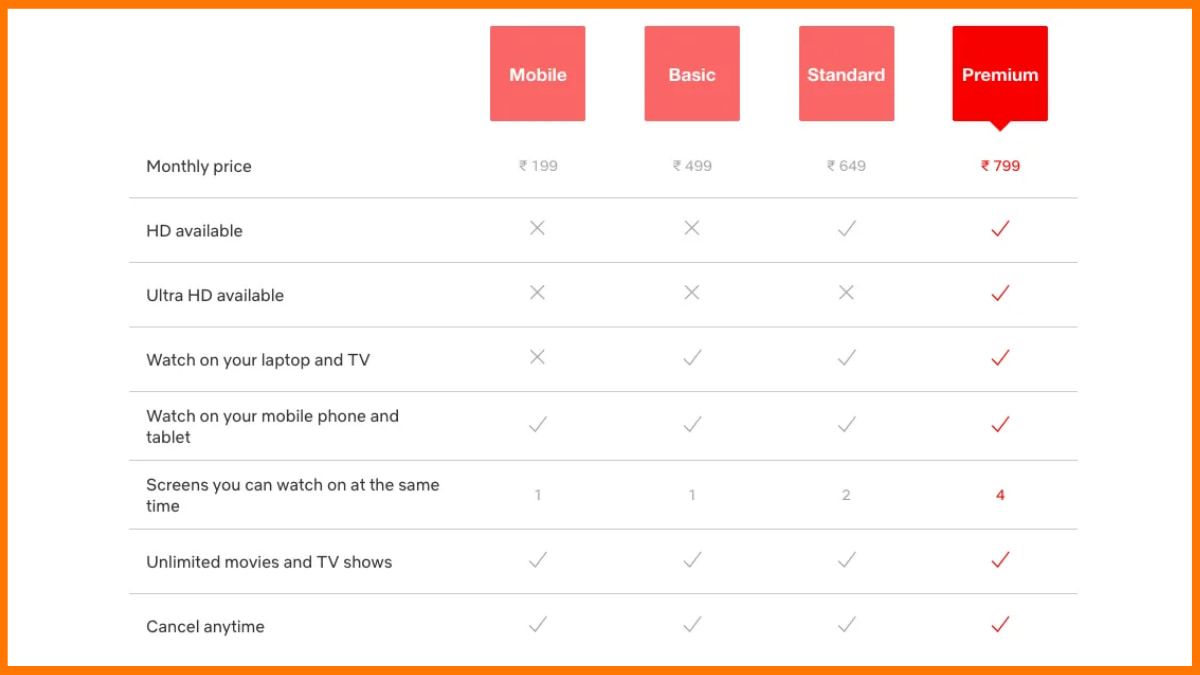
    Netflix Membership Pricing
    Netflix Membership Pricing

    Memberships are the very fuel with which Netflix works. Anything that can increase memberships or subscriptions are managed and promoted by this business vertical. This includes marketing, sign up prompts, pricing and even partnering with other companies for promotions. They manage and handle all the incomings and welcomings at the Netflix website and app.

    Studio

    Netflix Studio
    Netflix Studio

    A studio is a place where a piece of content is shot. Many of the content that Netflix produces is done in already set up studios. This is also a cost-saving or cutting method. This department works at planning, development, and all the pre and post-production activities for the content. Thus, they work closely with content verticals.

    Marketing

    Netflix Instagram Marketing
    Netflix Instagram Marketing

    This vertical is focused to spread awareness and promotions about the content that Netflix is producing. This is done through new or traditional media or a combination of both. You must have seen advertisements for Netflix exclusive movies and tv shows, this is the department behind those.

    Platform

    This is the team that ensures the efficient, secure and state of art use of technology tools to manage the whole working of the platform. The data analytics and engineering tools are managed here to provide personalised content to each and every member/subscriber.

    Some Facts about Netflix that might Interest you

    • Despite more competition, Netflix still has the largest subscriber count in 2020.
    • 60 million US adults have a Netflix subscription.
    • Netflix was originally called “Kibble”.
    • Netflix staffers think that you decide on a movie in two minutes.
    • The company is older than most users realise.
    • Netflix at its IPO sold its shares about 15 dollars, as its market grew, the share price went up to 350 dollars.
    • 41% of Netflix users are watching without paying thanks to password and account sharing.
    • Nearly two-thirds of US households now have Netflix.
    • Netflix was one of the first streaming services available as an app on different devices.
    • You’ll Soon be able to Stream Netflix in a Tesla.

    IPO Process in India: How is a Company Listed on the Stock Market?
    Many companies are planning for an IPO to raise funds. But how does a company lists itself on the stock market? Here’s the complete process.


    Conclusion

    Data analytics is the fuel that powers Netflix. Netflix doesn’t just work in managing content, movies, TV shows and entertainment but it has a lot of other data to handle as well. There is no efficient way other than “Big data” to handle such enormous amounts of data efficiently.

    Netflix does it so well that we do not even notice that change. It cleverly posts content recommendations that are exactly matched with our likes. The data analytics at Netflix brings tailor-made and personalised content to each and every subscriber.

    This makes Netflix best not only on the content basis but also on the overall user experience. That is the sole reason why we see steep spikes in Netflix viewerships over the years.

    FAQ

    How accurate is the Netflix recommendation system?

    Netflix’s Recommendation Engine is so accurate that 80% of Netflix viewer activity is driven by personalised recommendations from the engine.

    How do I get better recommendations on Netflix?

    Whenever you watch a show on Netflix, you can give a thumbs up or thumbs down. Each time you give a show or film a thumbs up, Netflix will likely recommend similar content.

    Is Netflix recommendation supervised or unsupervised?

    Netflix recommendation engine is a supervised quality control algorithm.

  • Top 5 Most common types of data integration methods and Strategies

    Creating and developing a massive fraction of data is always exciting and fulfilling. However, it doesn’t always get along with the insights from the data. Data Integration is closing this space with its advanced technology and development.

    Nowadays, Data integration is widely generating great advancements and growth to many companies about business intelligence. But the question that arises here is; How is it done? This could easily be explained with the various kinds of data integration which are proven to be brilliant.

    When it comes to data integration, there are certain types of data integration that are used more frequently. Together with this, cloud computing is also playing a significant figure in the development of the business field.

    Before we move further with the types of data integration, we should discuss more on what is data integration?

    What is Data Integration?

    Data Integration is a method to enhance the work speed and decision making by the executives and data managers by providing them with a combined data gathered from different sources and analysing them.

    The process of Data Integration involves a proper system for retrieving, presenting and locating Data. Later on, the data managers and analysts go through the verifications about the collected data and discover insights about business intelligence.

    Data Integration can only be understood completely by discussing the types of Data Integration which are commonly used in businesses. Therefore, let’s get started with understanding the most commonly used types of data integration methods.

    Data Integration Process
    Data Integration Process

    Application Based Integration
    Uniform Access Integration
    Common User Interface Integration
    Common Data Storage Integration
    Middleware Data Integration
    FAQ

    Application Based Integration

    The Application-Based Integration method is known for locating, integrating, and retrieving the collected data. It is basically program based specialized. You can easily transform the data with the different sources to make more consistent results. This method approaches the user with the collected data from various sources and research.

    Application Based Integration is quite a complicated method as there are tons of system interfaces and data formats that integrate the growth. But, it does have some restrictions when it comes to handling a large number of sources and proportion of data because of the requirements for the implementation of all integrated efforts.

    Therefore, the Application-Based Integration method is usually preferred for the non-complex and limited number of applications.


    How did Upstox suffer a data breach and What does it mean for the users
    Upstox is the leading discount broker in the country. Upstox was formerly knownas RKSV technologies. Upstox is backed by some of the top investors in thecountry which include Tiger Global and Ratan Tata. The company has nearly 30Lakh users making it the second-largest stockbroker in the country.…


    Uniform Access Integration

    Uniform Access Integration gathers and accesses the data from distinct disparate sets and combines them uniformly before presenting. This technique always brings great advantages such as easier data access with multiple systems, lower requirements of storage, creating a uniform and facilitated view of data for the user.

    Uniform Access Integration is mostly preferred when the business requires access to multiple, disparate systems. However, when accessing various sources the data integrity could be compromised.

    When the data request from the host system isn’t very complex or pressing, Uniform Access Integration can generate insights without even spending on creating a backup or copy of the data.

    Common User Interface Integration

    This technique works manually by locating the information to different sources and also, correlating each of them to get the required insights. And that’s why Common User Interface is often known as ‘manual integration’.

    In this technique, the relevant data are accessed from the different source systems or web pages in order to get them ready to operate by users. And the basic requirement for this technique is the user needs to have detailed knowledge of logical data representations, data semantics and locations. Also, the user must have worked with different user interfaces and query languages.

    However, the Common User Interface does not provide the unified appearance of the data. This technique comes with some scaling limitations that mean there is a limitation on how many numbers sources can be used and the volume of data must be small.

    Common Data Storage Integration

    Common Data Storage (CDS) is a data integration technique in which storage space is enabled for the user to manage and store the data with proper security through multiple applications or programs.

    Common Data Storage works by copying the data from certain source systems to a new system for users to operate. Moreover, Common Data Storage, also referred to as Data Warehouse collects data from various sources and then combines them to a specific centre position for the management.

    Unlike Uniform Access Integration, this technique includes data version management from different sources and allows the user to combine the data together.


    What led Uber & Lyft to Build a Database of Drivers? [Case Study]
    Uber and Lyft are working together in creating a database of their drivers. Theyare creating a database of the drivers who have been accused of sexual assaultfrom the customers. They are taking the list of drivers who have been bannedfrom the platform for sexual assaults and other crimes. They a…


    Middleware Data Integration

    Middleware Data Integration works by connecting applications from different sources and then transferring the data between them and databases. It is mostly preferred when a business is integrating legal systems with the new ones.

    Middleware Data Integration acts as an interpretation between these and is handy in such cases. The major benefits that come with this technique are easier access between the systems through simple communication through the network. And, the integration procedure conducts automatically with a similar duration each time.

    However, Middleware Data Integration comes with certain functionality limitations as it can only run in distinct types of system.

    Middleware Data Integration is widely preferred for businesses integrating the legal system with advanced modern systems.

    Conclusion

    Data Integration is often estimated as very simple and handy. But when it comes to operating them and interpreting them, it could be very complex and distinct based on the form it is being used.

    Data Integration can easily be explained as the combination of technical and business procedures that are used to gain valuable and appropriate information through disparate sources. That’s why through this article, we presented you with a good discussion on the data integrations and their different methods and techniques.

    FAQ

    What is data integration?

    Data integration is a process where data from many sources goes to a single centralized location, which is often a data warehouse.

    Which integration tool is best?

    Some of the top integration tools are Boomi, Celigo, Cleo, Jitterbit and MuleSoft.

    How is data integration done?

    In a typical data integration process, the client sends a request to the master server for data. The master server then intakes the needed data from internal and external sources. The data is extracted from the sources, then compiled into a single, cohesive data set.

  • How Big Data Is Transforming Sales And Marketing

    Big data is a field that is used to analyze a large amount of data of a company that can not be analyzed with traditional computing or software. It the collection of data of a company. Let us take an example to understand the whole scenario of Big Data.

    We are using our smartphones in our daily life many times. But we never thought about the data generated by smartphones in a day by using many applications present on our phone. Almost, 2.5 quintillion byte data is generated by a smartphone each day. It is not handled with traditional computing is called Big Data.

    Let’s have a look data is generated per minute on the internet,

    • Snapchat makes 2.1 million shares per minute.
    • 3.8 million search queries on Google per minute.
    • 1.0 million people log on Facebook.
    • 4.5 million videos watched on YouTube.
    • 188 million emails are sent per minute.

    To handle this lot of data we use the concept of 5V’s of big data.

    5V’s of Big Data
    4 Ways to Transform Sales and Marketing

    5V’s of Big Data

    Volume, Velocity, Variety, Veracity, and Value are the 5V’s to make the big data big business. Let us take an example of the healthcare care sector to understand all the terms of these 5V’s of Big Data industry.

    Big Data Sales And Marketing

    Volume

    Hospitals and Clinics generates a massive volume of data. 2314 Exabytes data collected annually. It is a huge data that can not be analyzed by using traditional computing or traditional software.

    Velocity

    It refers to the records of patients and test results. It is done in a very short time at a very high speed. It is recorded in very high so it is considered in the velocity group.

    Variety

    There are various types of data like structured data, semi-structured data, unstructured data. Examples of these data are:-

    • Structure data:- Excel Files
    • Semi-structured data:- Log Files
    • Unstructured data:- X-Ray Files

    Veracity

    Accuracy and Trustworthiness of data are considered as Veracity.

    Value

    Disease detection, Better treatment Reduce costs are considered as a Value category.

    This is an example of the healthcare sector. All the files of a company are stored in these 5V’s of the Big Data industry. It reduces the cost and stress of analyzing big data. It varies with the company to the company.

    4 Ways to Transform Sales and Marketing

    Big Data Marketing Examples

    Identifying Valuable Opportunities

    Evaluating more and more data will provide more and more opportunities for us. Evaluating data not just from inside the company but also from outside the company. Big data helps us to get opportunities to get involved in new business. Once we have collected data, we need good analytics. Analytics leaders believe in a new technique of business called “Destination Thinking”. Destination Thinking is used to solve business problems by questioning and answering and also involves writing in simple terms of data and analytics. By achieving big goals and vague, it can boost sales and marketing by using big data.

    Simplicity And Speed In Business

    The data is increasing at a speed of light day by day. This is very challenging for sales and marketing professionals. To tackle these challenging problems, technology helps us to create a better and most relevant interaction with customers. Also, by using predictive statistics, natural language mining, and machine learning help us to evaluate a large amount of data. Many companies also like to invest in algorithm marketing. Algorithm Marketing is a type of marketing that helps us to use big data and improve the speed and simplicity in sales and marketing activities.


    List of Angel Investors in Bangalore [With Contact]
    Bangalore, the silicon valley of India, is one of the most famous Indian citiesfor entrepreneurs. In this post, we have listed some of the most prominent angelinvestors in Bangalore whom you can reach out to. You will get to know abouttheir background and the sectors they like to invest in. You …


    Technique To Identify New Customers And Retain Existing Customers By Using Big Data

    The behavior of a customer is changing day by day. They are surfing various websites, channels, using various technologies to fulfill their demand or task. It is very critical to understand the decision of a customer because they are surfing various channels. It helps us to identify new customers and helps to retain existing customers. By using Big Data analytics we can understand the opinion of a customer to create the best business marketing strategy that will lead to business growth. We can one more method to collect the data from customers is from purchases of products, reviews of products, and recommendations of products. With these, we can analyze the opinion of customers about the services and products of the business. We can increase the conversion rate of the new and existing customers over the business.

    Real-Time Data Analytics And Marketing

    Big Data Marketing 

    Big data analysis helps us to optimize the market performance which helps us to reduce the cost of the product and time in services. Real-time data helps us to take immediate action as per the current requirement. It is very critical in analyzing data from GPS, IoT sensors, clicks on a page of a website, and other real-time data.

    After the discussion on various points above, we can say that Big Data is one of the most important data that plays a key in business. It helps us in making marketing decisions and also helps us to create the best marketing strategy for promoting business marketing and sales. Proper analysis of Big Data can lead to business growth and can succeed in any business.

    You can use Big Data Analysis to optimize your marketing strategies and you can achieve your goals as per your wish. You can take the help of tools of Big Data Analytics Software Companies to use advanced technologies in the Big Data field. Chatbots is the most popular strategy to improve sales and marketing and help in achieving goals in Big Data Marketing.


    Ingenious examples of Marketing Strategies | startuptalky
    ‌‌Marketing is no doubt, the backbone of any company in the 21st Century. Andwhen it comes to big brands, they leave no stone unturned for it. They have ahuge research team to calculate the risks first. Then they have a separatemarketing department which is always on the go or may outsource it …


    FAQs

    What is Big Data?

    Big data is a field that is used to analyze a large amount of data of a company that can not be analyzed with traditional computing or software. It the collection of data of a company.

    What are the three types of big data?

    Big data is classified in three ways:

    • Structured Data
    • Unstructured Data
    • Semi-Structured Data

    Why is big data important in marketing?

    Big data is important in marketing as it allows a much better targeted approach and it helps a company connect with their customers and service users much better and in a much more personal way too.

    Where is Big Data stored?

    Most people automatically associate HDFS, or Hadoop Distributed File System, with Hadoop data warehouses. HDFS stores information in clusters that are made up of smaller blocks. These blocks are stored in onsite physical storage units, such as internal disk drives.

    What is an example of big data?

    Example of big data:-

    • Discovering consumer shopping habits
    • Personalized marketing
    • Fuel optimization tools for the transportation industry
    • Monitoring health conditions through data from wearables

    List of Angel Investors in Delhi [With Contact]
    Angel investors are sometimes marked as Private investors or Seed Funders.Though known by different names, their main aim is to invest in startups or newventures, thereby helping them to grow and create a presence in this dynamicenvironment. If you are looking to get an insight about Angel Invest…


  • Top 7 Tech Trends Every HR Must Look Out for in 2021

    Technology has an impact on every industry. The recruitment industry has also been influenced by various technologies in past. The industry is experiencing rapid growth as a new players are entering the market. Technology has advanced at a ridiculous pace in the last ten years. Every company should be updated about upcoming tech trends in the market. As we near the end of 2020 lets look at some Top Tech Trends Every HR Must know in 2021.

    Artificial Intelligence in The Recruitment Process
    Feedback Tools to Improve Engagement
    On the Job Training
    Employee Experience Platforms
    Data Analytics Transforming HR
    Cloud based HR
    Giving importance of the employees mental health

    Artificial Intelligence in The Recruitment Process

    HR tech trends in 2021
    HR tech trends in 2021

    One of the most well known tech trend in HR is the use of Artificial intelligence which growing exponentially in every field from health to teaching to everything. In 2021, AI will play a major role in the recruitment and hiring process. AI can save the time of recruiters to screen and shortlist candidates. The recruitment process will also speed up with the help of AI as it can answer repetitive questions through a chatbot.


    Artificial Intelligence: How is it going to change India?
    Our day starts with Alexa’s news updates and ends with Saavn’s suggested musicin our ears. The technological pillars of the fourth industrial revolution hasalready made a home in our daily lifestyle. Circumventing interaction withgadgets and software in the 21st century, is next to impossible. I…


    Feedback Tools to Improve Engagement

    Every organization wants to improve workforce engagement. As an HR it is important to ensure that your employees are passionate about their jobs. Various feedback tools are available to improve the workplace environment and employee engagement tools for employees. There’s a lot of distractions in the modern workplace, especially for employees who use internet-connected devices to complete their daily tasks. These feedback tools will help management to better understand their employees. There are various Employee Engagement Software and Tools in 2021

    On the Job Training

    On the job training is an important top trends of HR that helps in the prosperous growth of the organization. Employees require continuous mentorship and skill development training to perform well in their jobs. On job training helps employees get business demands met more promptly. This also develops a great mindset of always learning in employees. Many companies have adopted Different Policies to Upskill the Employees.

    Top HR trends of 2021

    Employee Experience Platforms

    There are various platforms available to rate companies on their Employee Experience. Employees don’t hesitate to share their experience on these platforms which can affect the company’s reputation. A positive employee experience makes it easier for companies to attract top talent in this competitive market. This generation is the largest part of the workforce and it is important to join millennials in your workforce.


    How to Inspire Employees to Work – Guide to Retain Employees
    A workplace is where we spend one third (8 hours) of our day which is more timethan we do spend at home. Every company focuses on productivity. There are somemilestones that people have to go to make work successful and tangible.Deadlines are key areas that have to be met in order to measure succ…


    Data Analytics Transforming HR

    Many organizations employ data analytics tools in human resources to improve hiring decisions. It can also help to identify factors that have the most significant influence on the employee. Employee data can be used to create a personalized experience to engage employees. Data analytics can be presented visually in graphics or statistical reports to better understand and take action.

    Technology has advanced at a ridiculous pace in the last ten years. HR needs to identify the best workforce for their organization. The impact of technology has also enhanced the hiring experience for both the candidates and the hiring teams. Various tools and technologies are available for HR to facilitate the recruitment process.

    Cloud based HR

    The HR department is known to help key functions such as recruiting, managing the data of the employees managing the employees performance, hiring, etc. One thing they all have in common is data processing. Before the cloud based solutions like PeopleSoft, the HR managers would take care of all these details. Which is why with the introduction with cloud based HR solutions improving the process of hiring, getting an employer brand and updating information and data security.

    Giving importance of the employees mental health

    The mental health of the employees must be given importance because they are what make or break the company. For taking care of their wellbeing the HR department can hold a weekly office yoga session or a healthy Friday. Not only that the the physical, and financial health of the employees must also be given equal importance. And as such, the number one condition when it comes to getting your workforce ready for the future.

    Frequently asked questions – FAQs

    What do HR department do?

    The HR takes care of the employer branding, recruitment or selection, Onboarding, performance management, learning and development and most importantly workplace safety and culture.

    What does a HR manager do?

    The HR manager has a lot of responsibilities such as managing their internal team, stakeholder management, making new policies for recruitment etc.

    What does an HR analyst do?

    The HR analyst works on the collection, analysis, and reporting of data.

    Adding new tech trends to the HR departments in improving the HR policies, growth of organisation helps in performing the basic functions of HR  like recruiting, onboarding, training the employees, etc.

  • The Big Data Market Insights

    The big data market is becoming a growing area of cognizance throughout the diverse end-use industries. The big data market helps industries to manage their important data hence, permitting businesses to manipulate huge chunks of data efficiently. Data mining today is extremely important for companies, as the world has shifted online. With the help of quality data regarding consumers, their wants and needs companies can ensure a quality success rate.

    Corporations with the help of the big data market get efficient and become exceptional in coping with it, in the end, increasing the big data analytics market in retail becoming valued at $4.43 billion in 2019, and is calculable to achieve $17.85 billion through 2027, registering a CAGR of 20.4% from 2020.

    Manufacturers steadily spend money on R&D for growing their company’s statistical data to deliver good services. Big data market vendors are predicted to pay attention to mergers & acquisitions and mission investment ascribing to generation development and complex ecosystems. The big data industry report entails big data market players walking the game, a number of which can be as follows

    • IBM
    • HP Enterprise
    • Teradata
    • Oracle
    • SAP
    • EMC
    • Amazon
    • Microsoft
    • Google

    How to do Competitor Analysis for Website? | Analyze Competitor Website
    Competitor analysis refers to identifying the competitors and evaluating theirstrengths relative to those of one’s own product or service. One should evaluatetheir competitors by categorizing them between different groups, based on theircompetitive strategy and list their product or service, its …

    The Big Data Market Regional Insights

    North America emerged as a major Data market industry accounting for more than 30% of the full sales proportion in 2015. The emergence of the big data market has given an array of possibilities to numerous agencies to control treasured information circulation and remodel it into widespread information. Europe is likewise predicted to witness a full-size increase over the following 9 years due to the fact the administrative and authorities sectors emphasize a growing range of on enhancing operational performance.

    The Big Data Market Analysis by Region

    Asia Pacific is predicted to outperform the global data market with CAGR exceeding 17% over the forecast period. North America will guide the path for the duration of 2027. Regionally, North America attributed to almost two-fifths of the global market analytics in retail in 2019, and is anticipated to preserve its dominant proportion through the Adoption of AI .

    Big data analytics market research in retail companies is forcing the marketplace boom in this province. On the other hand, the Asia-Pacific place is envisioned to paint the quickest CAGR of 23.5% from 2020 to 2027.

    The adoption of cloud-enabled global data analytics in retail software programs , growth in recognition of speedy net connectivity, ever developing cell phone penetration, and growing recognition of e-trade organizations are the foremost things that propel the boom in this region.

    Why Business Analysts are Important for your Organisational Growth?
    In today’s world, the growth [https://startuptalky.com/tag/business-growth/] anddevelopment is happening in every sector. There is a development in technology,infrastructure, science, as well as management. This rapid growth is making lotsof things go out-dated. The products or services without t…

    Big data market trends are valued at $4.99 billion in 2018 and is said to reach $61.42 billion by 2026, this will make Big Data a Service which is a cloud-based total framework and which will give statistics answers to firms on their demand. The education & improvement section is predicted to witness an exponential boom over the forecast period.

    As firms make investments closely in analytics tools, staff, and understanding for greater desirable enterprise decisions, the want for powerful education gets an upward thrust to well shape and examine information for green company decision-making.

    The Global Big Data And Business Analytics

    The Global data market in Hardware

    The hardware phase accommodates server, garage, and community devices. The community device phase is predicted to witness an increase at a CAGR exceeding 20% over the forecast period. This is ascribed to the reinforcement of a new community protection paradigm ensuing from the growing emphasis on greater suitable protection necessities worldwide.

    The global data market size is also anticipated to witness a healthy growth over the subsequent few years because of the elevating name for hybrid and public clouds, which is predicted to strain the need for a greater acceptable global data market size over the imminent years.

    Additionally, the server phase is also anticipated to flourish over the following nine years. The global data market size is anticipated to be the quickest developing software program phase with a CAGR more than 15% over the forecast period.

    This is mostly attributed to the growing name for customers to get admission to information as and whilst required, which has drastically ended in a push for cellular information also it is predicted to preserve the very best CAGR of 23.1% from 2020 to 2027.

    MobiKwik Success Story – Business Model | Founders | Revenue | Funding | Competitors
    Using a Mobile Wallet has now turned out to be a habit of many. Easy hassle-freepayment and no worries about hunting for change every time you purchasesomething probably is a major benefit of using a mobile wallet. While today manyinternational players are providing mobile wallet services in Indi…

    The Big Data Market in End-Use

    Organizations collect and shop data with the intention to extract quality statistics from ancient data to gain better insights. This is performed for the purpose of analyzing and making particular decisions, which helps in improving operational efficiencies, threat mitigation, and rate reduction. Understanding the cap potential of big data & analytics, numerous sectors have started out deploying the same throughout their systems.